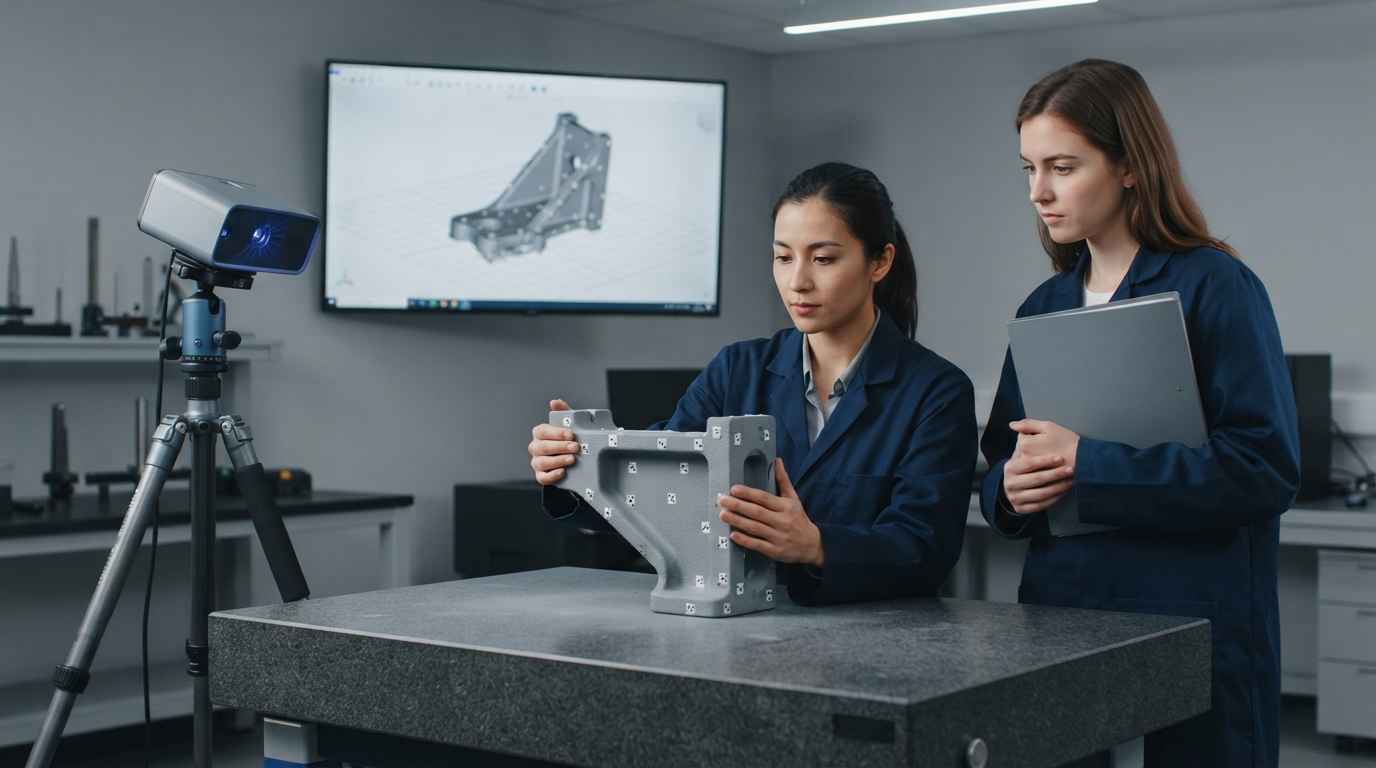

3D scanning dimensional inspection is the numerical comparison between the real geometry of a manufactured part and the CAD model that defines it, expressed as a deviation at every point on the surface.
You have the first part off a production run, or a batch the customer has sent back, and you need to know whether the geometry matches what was designed. In product development that comparison closes the gap between the model and the physical part, and the model you start from is the one that comes out of 3D design and modeling using CAD, with its dimensions, its tolerances and its reference system.
What settles the result is not the scanner. It is the chain that runs from the resolution you capture the surface at to the reference you align the point cloud to. Mechanical development links the two, and 3D scanning and digitization of parts covers the capture.
3D DESIGN AND MODELING USING CAD
Do you need to compare a manufactured part against the model that defines it? Discover our 3D design and modeling using CAD service

What 3D scanning dimensional inspection actually checks
3D scanning dimensional inspection checks three separate things: whether the dimensions called out on the drawing fall inside tolerance, whether the free-form surfaces stay inside their allowable envelope, and whether the part will assemble with the ones next to it.
The deliverable that decides is not the map, it is the table of dimensions with their deviation and its sign. A report that hands over only the map leaves the verdict to whoever looks at it, like any quality control of industrial components whose criterion was not set before measuring.
What a point cloud gives you compared with a dimensioned drawing
A point cloud is a set of coordinates of the part’s real surface, with no interpretation of which part of that surface is functional. The drawing does the opposite: it ignores almost all the geometry and declares which dimensions matter, within which limits and relative to which references.
Between the cloud and the drawing sits a stretch of interpretation that consists of extracting from the raw data the features the drawing names (a seating plane, a hole axis, a mating diameter) and measuring those features. That primitive fitting is where the scan stops being a photograph and becomes a measurement.
One practical consequence follows: anything not on the drawing has no criterion. The exception is reverse engineering for product development, where the cloud is the end product rather than a means to one.
Point density and resolution against the tolerance you are judging
A scanner’s resolution defines the smallest geometric detail it can tell apart, and it is not the same as its accuracy, which is how close the measured coordinate is to the real one.
Point spacing on structured light and laser triangulation systems runs, depending on the field of view, in the order of two to ten hundredths of a millimetre. A detail needs several points on it to be defined, so a radius or a chamfer below roughly three times the point spacing comes out rounded in the mesh even when the part has it perfectly formed.
The working rule is to compare the uncertainty of the system with the tolerance you are about to judge, not with the size of the part. If the dimension carries two hundredths of tolerance and the scanner plus alignment leaves you an uncertainty of the same order, the measurement decides nothing, because any result near the limit is consistent with a good part and with a bad one.
A scanner with five hundredths of point spacing describes the shape of a housing very well and cannot adjudicate an H7 fit. Scanning resolution is chosen against the tolerance you have to judge, never against the size of the part.
Aligning the point cloud to the CAD, best fit against drawing datums
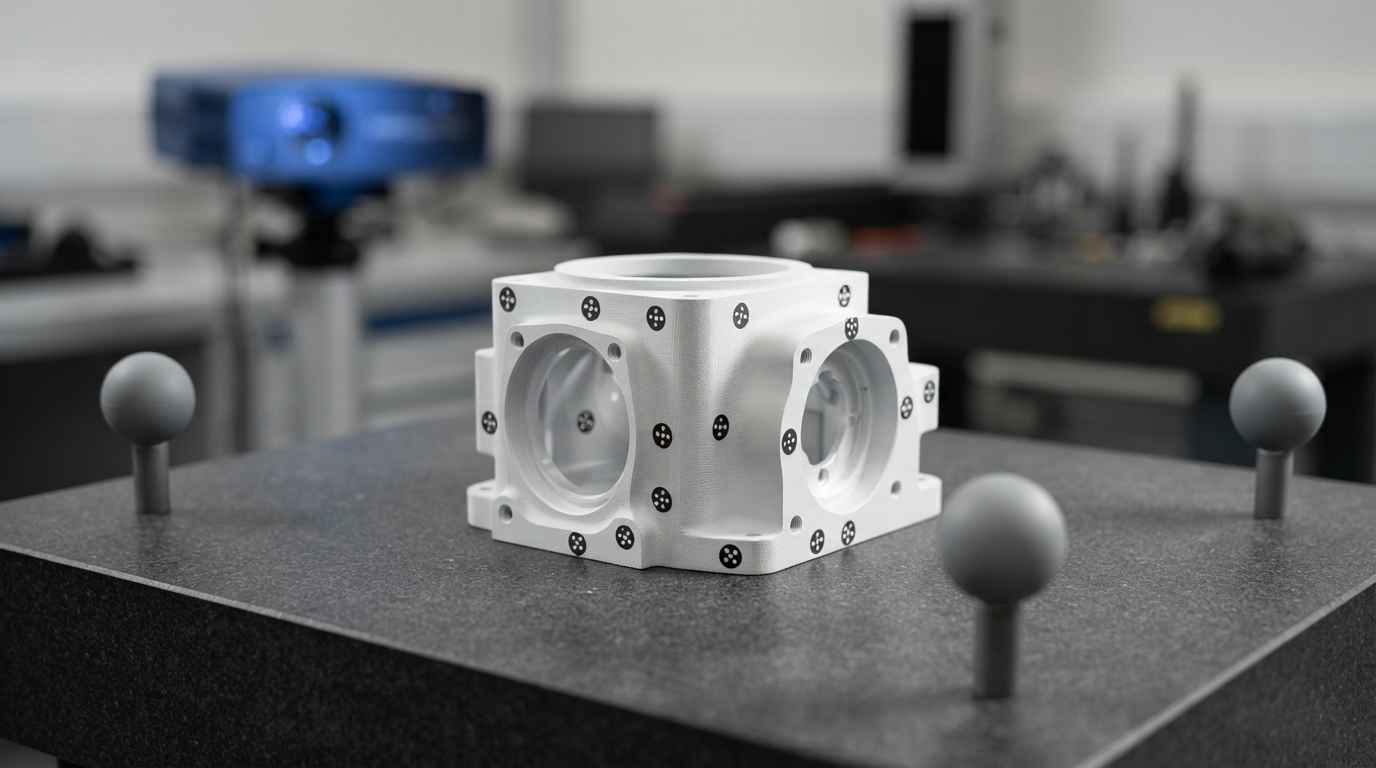
Alignment is the operation that places the point cloud onto the CAD model, and it sets the value of every deviation you will read afterwards. The same part and the same scan produce different verdicts depending on how they are aligned, which is why alignment is the first thing a third party will look at if the result is disputed.
Best fit alignment, what it spreads out and what it hides
Best fit places the cloud by minimising the sum of the squared distances between the measured points and the CAD surface. It spreads the misfit across the whole part and delivers the smallest deviation map the geometry allows.
The trouble starts when the part has an assembly function. Best fit splits a squareness error between the two faces involved and leaves each at half the real deviation, so neither reaches the limit and the map comes out green. The part will not go into the fixture, because the fixture does not do best fit: it seats on one face, orients on a second and stops against a third point. Dimensional verification of PCBs against drawing dimensions before assembly is a check of exactly that kind.
Datum alignment, the reference system that governs the verdict
Datum alignment reproduces in software the physical seating the drawing declares, so that deviations are measured from where the part is going to be assembled rather than from a compromise position.
ISO 5459 sets out how datums and datum systems are specified and interpreted in geometrical tolerancing, including the order of precedence between the primary, secondary and tertiary datum. That order dictates the alignment sequence: the primary removes three degrees of freedom by seating on a plane, the secondary removes two by orienting, and the tertiary removes the last one. Reversing the order, or swapping a datum for any convenient reference plane, produces a report that measures well and concludes badly.
Three situations call for a pause before aligning: the drawing declares no datums, so the reference system has to be agreed in writing; the datum is a surface the scanner cannot see (a blind hole, an internal face), which calls for a contact measurement alongside; or the datum is itself deformed on the part in hand.
Best fit answers whether the shape is the designed one. Datum alignment answers whether the part will assemble. They are two different questions, and the report has to say which one it answered, because the answer changes with the reference.
TELL US ABOUT YOUR CASE
Do you have a part that will not assemble and a drawing that says it is fine? Send us the part, the drawing and the CAD model and we will propose the dimensional inspection plan
How to read a deviation map without over-concluding
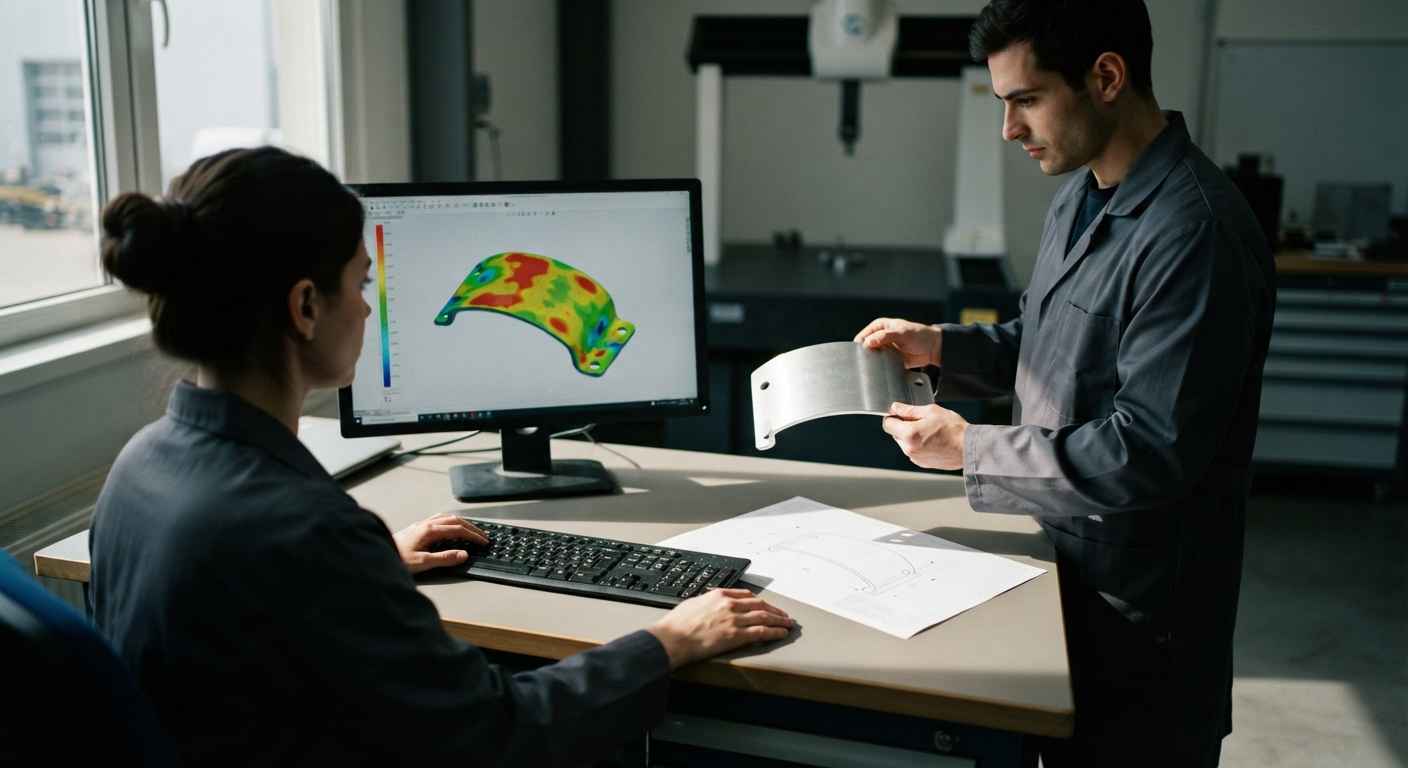
A deviation map is the colour representation of the distance between each measured point and the nominal CAD surface, with its sign.
Colour scale, threshold and the sign of the deviation
The colour scale sets which deviation is painted which colour, and changing it changes the look of the map without changing a single number: the same scan plotted at plus or minus a tenth comes out almost entirely red, and at plus or minus a millimetre almost entirely green. The threshold is tied to the tolerance, because if the green band is wider, the map approves zones the drawing rejects.
The sign reads as process information. Excess material points to added thickness, to a worn fixture or to less shrinkage than expected, and missing material to the opposite. The distribution separates causes: a deviation that is symmetrical about an axis suggests shrinkage or temperature, and one concentrated in a single zone suggests a support or a clamp.
From the deviation map to the dimension called out on the drawing
Converting the map into dimensions is the step that makes the scan usable.
That report has four minimum columns: the dimension as it appears on the drawing, the nominal value with its tolerance, the measured value and the deviation from the nearest limit.
Not every characteristic is closed out by the same method, and picking the right one avoids the expensive report that measures a great deal and decides little.
| What you have to verify | Method that closes it | What the result gives you | Practical limit of the method |
|---|---|---|---|
| Shape of a free-form surface (housing, pressing, blade) | Optical 3D scanning and comparison to CAD | Deviation across the whole surface, with sign | Will not support fits held to a few microns |
| Mating dimension between two parts | Coordinate measuring machine with a probe | Value of the dimension with its uncertainty | Measures where it probes, not in between |
| Geometrical tolerance referenced to datums | Datum system alignment, by scanning or by contact | Deviation from the assembly reference | Needs an accessible, properly defined datum |
| Internal geometry or inaccessible channel | Industrial computed tomography | Complete geometry without cutting the part | Resolution tied to wall thickness and density |
| Surface roughness and texture | Contact roughness tester or optical profilometer | Roughness parameters of the profile | Outside the scope of a form scanner |
| Distortion after a thermal cycle or a test | Scanning before and after with the same alignment | Displacement field between the two states | Needs the reference to have stayed put |
When the scanner is not enough and the job goes to a coordinate measuring machine
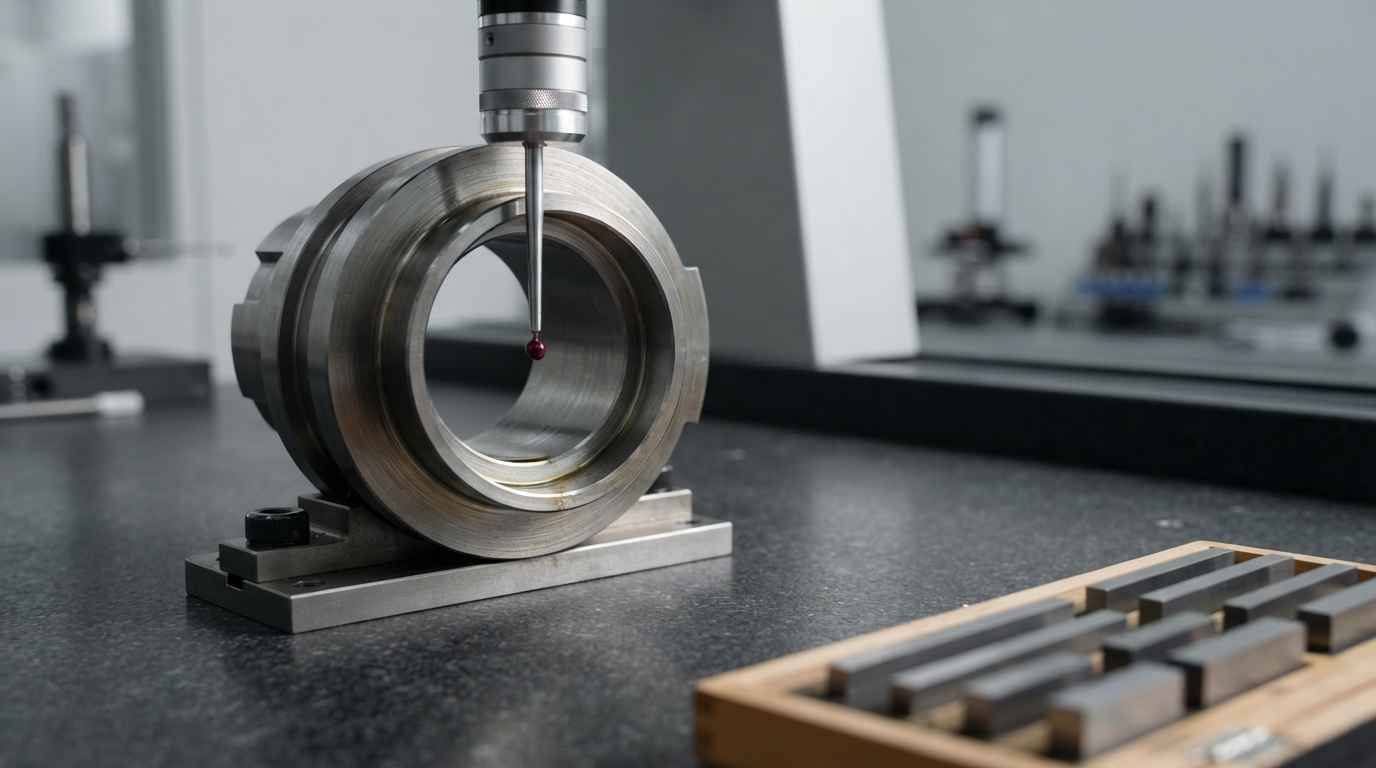
3D scanning stops being the right method when the tolerance approaches the uncertainty of the system, when the characteristic is an isolated feature rather than a surface, or when you need a small declared uncertainty. In those cases the coordinate measuring machine is what closes the job.
Dimensions and tolerances 3D scanning will not support
Mating dimensions held to a few microns fall outside the practical reach of an optical surface scanner, because the uncertainty of the whole chain is the same order as the band you have to discriminate, while a measuring machine’s probe works an order below that. There are also geometries the scanner cannot see: deep small-diameter holes, threads, narrow slots and surfaces shadowed from every available view.
On a real part the split is usually mixed. Form surfaces by scanning, mating dimensions and tight geometrical tolerances by contact, and a common reference system so that both sets of results can be read in the same report. That double check then feeds optimisation and simplification of parts.
Scanning is the method of choice when there is no drawing and one has to be built. It is the starting point when you need to replicate a component with no technical drawings and for reverse engineering an obsolete component, where the cloud becomes the model and the model becomes the drawing that was missing.
Traceability, calibration and declared uncertainty
A dimensional result is defensible when it carries three things, an identified method, calibration traceable to standards and a reported uncertainty.
For optical area scanning systems, the VDI/VDE 2634 guideline defines the acceptance and reverification tests, with part 2 covering systems based on area scanning and part 3 covering multiple view systems. Those tests yield the parameters that describe the equipment (probing error of form, sphere spacing error and length measurement error), and those are what to ask for on the certificate.
The uncertainty is then used against the specification limit, and that is where ISO 14253-1 comes in, setting the decision rules for proving conformity or nonconformity with a specification from the measurement uncertainty. Its consequence is a guard band: to call a part conforming you have to be inside the limit with margin, and outside with margin to reject it.
Traceability lives in the artefacts the system is checked against before each session (calibrated spheres, ball bars) and in the record of that check with the date and the room temperature. Thermal expansion counts: steel moves in the order of twelve microns per metre per degree, so measuring at twenty-five degrees a part dimensioned at twenty leaves a difference you have to correct or declare, exactly as in obtaining components through reverse engineering and 3D scanning so they can be manufactured again.
A measurement with no uncertainty is not a result, it is an opinion with decimal places. Declaring the uncertainty of the scan and applying the decision rule turns a colour map into an acceptance or a rejection that a third party can check.
The verdict sits in the alignment and the uncertainty, not in the colour
3D scanning dimensional inspection rests on a fixed order. First you write down which dimensions are being judged and to what tolerance, then you choose the resolution against that tolerance, then you align the cloud reproducing the drawing’s datum system, and only then do you read the map and turn it into dimensions with their deviation and sign.
If you have a part that will not assemble and a supplier telling you it is within drawing, send us the part exactly as it came off production, the CAD model and the drawing with its tolerances and datums, and if you have one, a part from the batch that did assemble. We send back the table of measured dimensions with their deviation, the map aligned to the drawing’s reference system, the difference against best fit and the uncertainty each value was issued with.
Frequently asked questions
What criterion applies if the drawing has no tolerances and all you have is the CAD model?
With no written tolerances there is no conformity to establish, so the first step is to agree them before measuring. There are three usual routes. The drawing invokes a general tolerance system, and you apply the grade it names. The assembly defines the critical dimensions by function, and only those get toleranced from the assembly clearances. Or there is nothing at all, and the way out is to measure several parts that did work and use their spread as a provisional reference. What does not hold up is scanning first and setting the threshold after seeing the map, because then the criterion is fitted to the result instead of judging it.
How many parts do you have to scan before you can say anything about the whole batch?
One part describes that part, and talking about the batch needs units from several positions in the run. In practice, three to five parts taken from the start, middle and end of the run, or from different cavities on a multi-cavity mould, are enough to separate a process drift from an isolated defect. If they all deviate in the same direction and in the same zone, the origin is the fixture or the model; if the deviation changes from part to part, the origin is process variability. Scanning twenty parts from the same box costs twenty times as much and tells you what one would have.
What drives the cost of a 3D scanning dimensional inspection?
Cost is driven by how many dimensions have to be reported, the size and accessibility of the part, and whether the scan needs backing up with contact measurement. Capture itself is quick; what eats hours is the processing, the datum alignment and the extraction of each dimension with its value and deviation. A global form report on an accessible part is short work, and one covering thirty dimensions with geometrical tolerances and internal datums multiplies the effort. The biggest saving comes from arriving with the drawing marked up and the critical dimensions flagged, because that lets us measure what decides instead of reporting everything.
What do you risk by accepting a part on a deviation map with no declared alignment?
You take on the verdict of an alignment you never saw, and the assembly risk that goes with it. A map produced by best fit can show the whole part inside tolerance and hide an angular deviation the fixture will certainly find, because physical seating does not spread the error, it concentrates it at the last contact point. You discover this on the line, with the batch already received and your negotiating position gone, because the report you hold says the part is good. Asking for the alignment used, the colour scale and the extreme values costs one sentence and avoids that outcome.
How long does a dimensional inspection take, and when is the right moment to ask for one?
Lead times usually run from one to four weeks depending on scope. The point of highest value is the first part off the run, before production is released, because a deviation caught there is corrected in the fixture and not across thousands of units. The second is the receipt of a disputed batch, with the part still unassembled and uncleaned. If you are at either point, request an assessment with the drawing and the CAD model and we will tell you which dimensions to measure, by which method and to what uncertainty before we start.