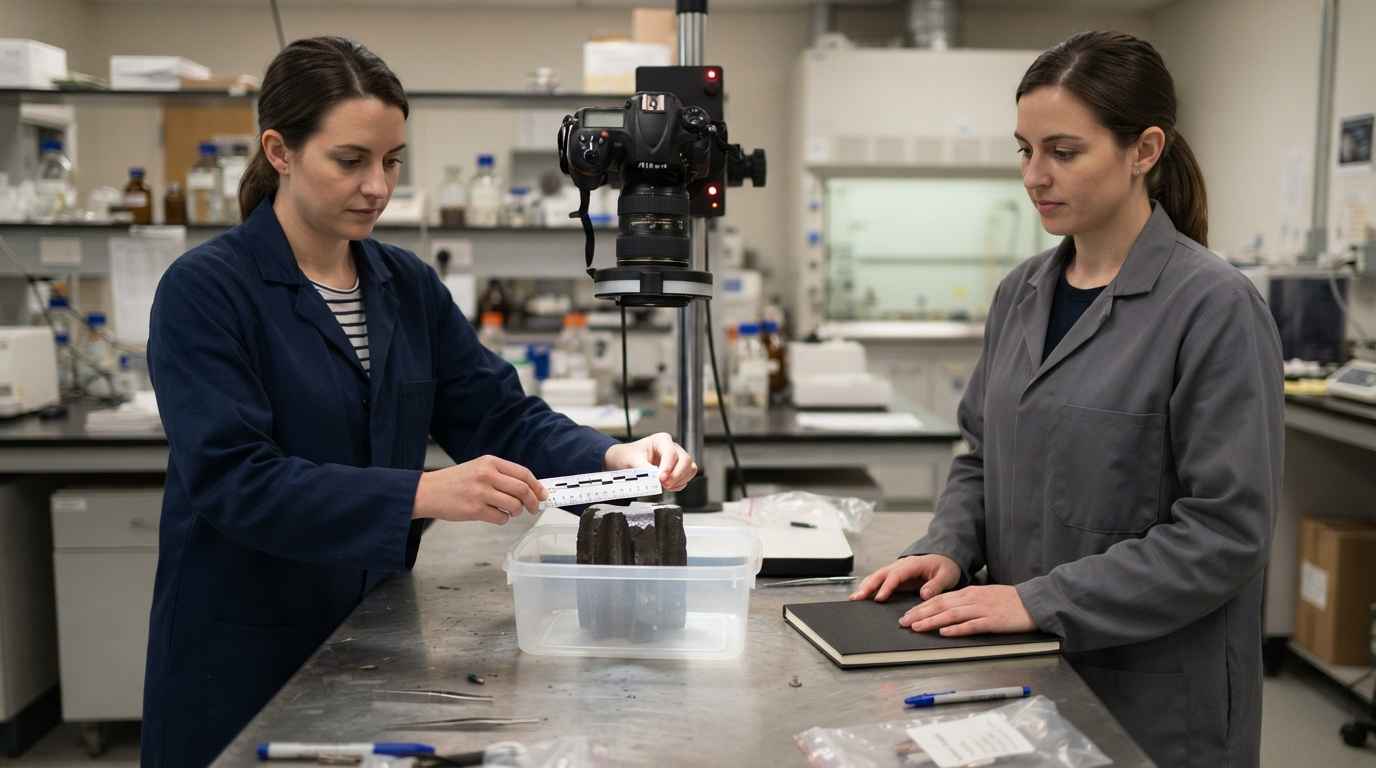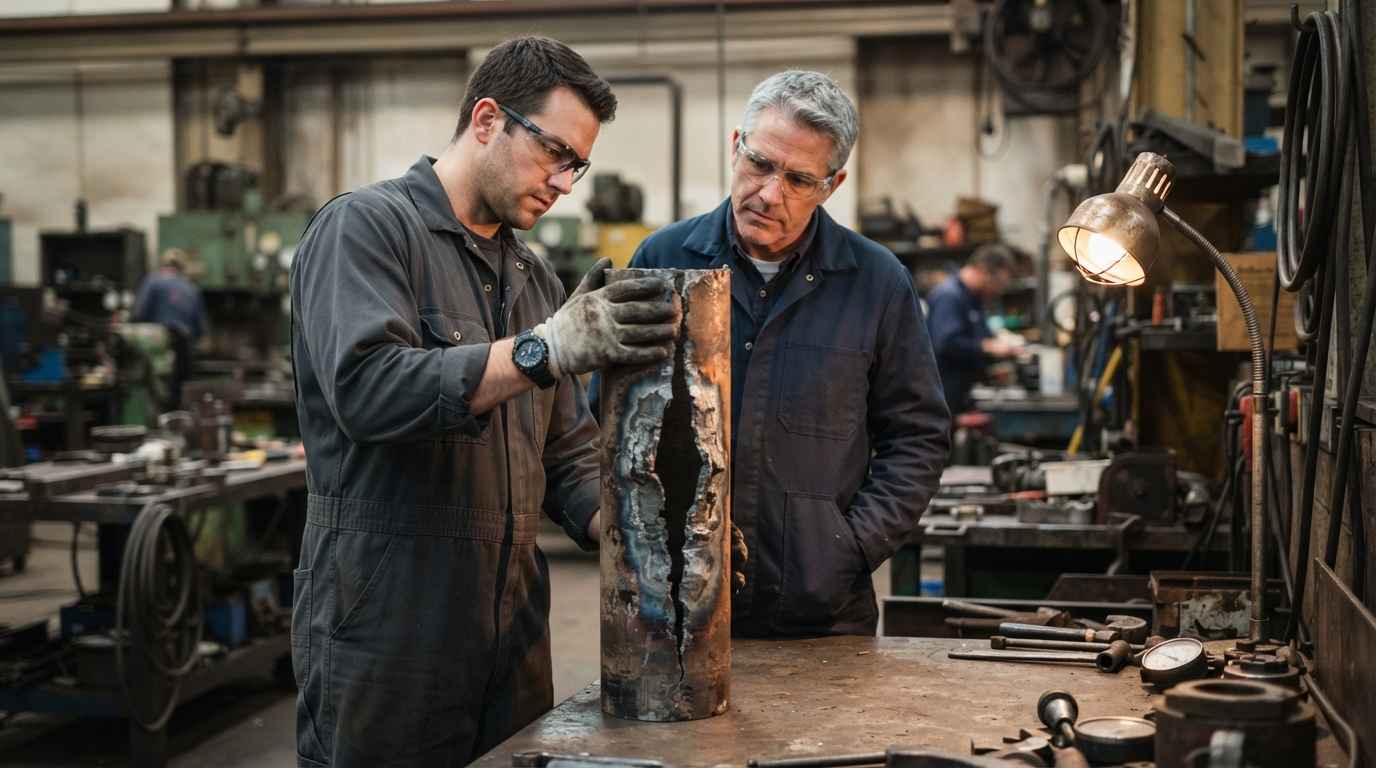

Power plant component failures happen when temperature and pressure activate damage mechanisms that do not appear at room temperature, and that the material accumulates cycle after cycle until the crack goes through the wall.
A superheater tube, a turbine blade, a steam flange or an exchanger bundle work for decades under conditions in which steel creeps slowly under constant load, oxidises and changes its microstructure. That is why failure analysis in this sector starts by narrowing down which mechanism acted, not by looking for a manufacturing defect.
Forensic engineering applied to this equipment has a constraint of its own, which is that the part arriving at the laboratory has been exposed for thousands of hours, so the material under test is no longer the one that was installed. That ageing is part of the evidence, not noise to be subtracted.
FAILURE ANALYSIS
Has a component that runs at temperature and pressure failed in service? Discover our failure analysis service

What sets power plant component failures apart
Power plant component failures are set apart by three conditions that rarely coincide in other sectors: high sustained temperature, internal pressure, and starts and stops that superimpose cycles of thermal strain on top of that base. Each on its own is handled by calculation; the three together change the failure mechanism.
A steam plant superheater works around 540 to 600 degrees Celsius at 170 to 300 bar depending on the cycle, and a gas turbine blade takes gas above 1,200 degrees Celsius while keeping the metal near 900 thanks to internal cooling and the thermal barrier.
Below about 400 degrees Celsius a component holds what its yield strength says. Above that, what decides is time under load, and a properly sized part fails all the same after twenty years in that regime.
Thermal cycling from starts and stops
Every start and every stop imposes a temperature gradient through the wall, and the side that heats first expands against the side that is still cold. That restrained expansion generates strain, not an external load, and it is what accumulates thermal fatigue damage.
The number of cycles is the figure usually missing from the file. A unit that starts and stops daily accumulates on the order of 300 to 400 cycles a year, so that in a decade it passes 3,000. The arrival of renewable generation has turned units designed for continuous running into cycling units, a change of regime that also affects the choice of materials for new energies and their compatibility with hydrogen.
The zones where damage concentrates are geometric and they repeat: tube-to-header joints, welds between different wall thicknesses, nozzles and points where two materials with different expansion coefficients meet. In that last case no gradient is needed, it is enough to raise the temperature uniformly for the two to want to grow differently, and measuring the thermal properties of both quantifies that mismatch before redesigning the joint.
Internal pressure and sustained stress at temperature
Internal pressure holds a constant hoop stress in the wall, and at high temperature that stress produces continuous deformation instead of a fixed one. The result is progressive thinning which, by reducing the wall, raises the stress and accelerates the process.
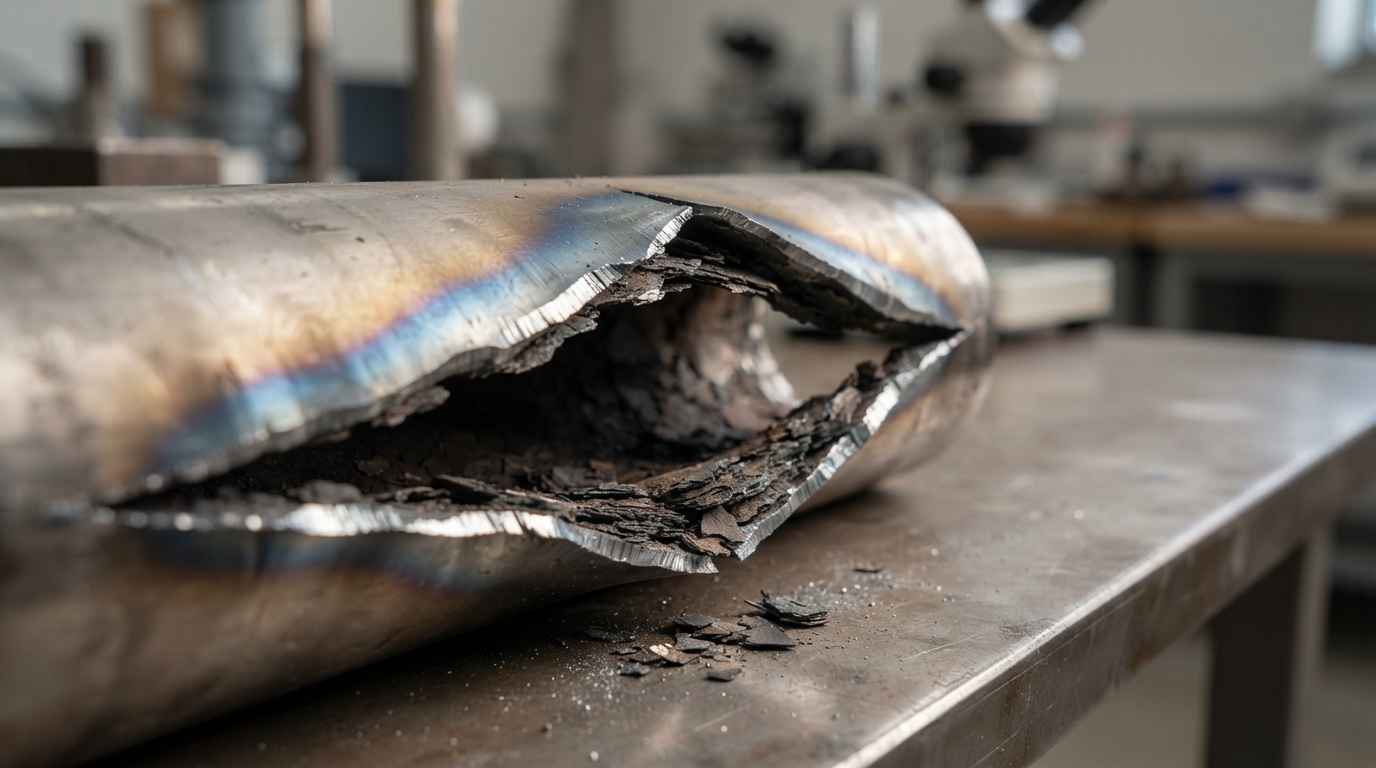
Thermal fatigue at high temperature and pressure
Thermal fatigue is the cracking produced by the strain that temperature gradients impose when expansion is restrained, with no variable external mechanical load. The origin is on the face taking the thermal shock, and the crack grows inwards perpendicular to the surface.
How a thermal fatigue crack starts and grows
A thermal fatigue crack starts at the hottest surface and where the geometry concentrates the strain, because that is where each cycle’s plastic strain is greatest. It needs no pre-existing defect, although a weld defect or a machining mark brings nucleation forward.
The strain imposed by a start is large, so damage accumulates in the low-cycle regime, below a few tens of thousands, against the millions a small-amplitude vibration withstands. That changes the test used for comparison, because ASTM E606 describes strain-controlled fatigue testing, which is what represents this case, and it does so isothermally: the gradient has to be added with a custom thermal cycling setup.
Between cycles the open crack oxidises inside, and the oxide is trapped when it closes, leaving a dark trace recognisable in section. The fatigue analysis of materials and redesign of cracked components shows how that evidence translates into a change of geometry and not of material.
What separates thermal fatigue from mechanical fatigue
Thermal fatigue leaves a network of short cracks spread over a zone, and mechanical fatigue leaves a single crack that dominates and grows. That difference in pattern is visible before anything is cut and it steers the whole analysis.
The reason is that thermal strain acts on the entire affected surface at once, nucleates at many points and each crack relieves the strain around it. Beach marks, which in how to identify a fatigue fracture in materials are the signature of cyclic advance, are blurred here by the oxide and have to be looked for in the polished section.
The third criterion is where the origin sits. A mechanical fatigue crack starts where the stress is highest, which is a calculated figure; a thermal fatigue crack starts where the gradient is highest, which is usually somewhere else. Comparing the two positions against the equipment’s fatigue design for cyclic loads separates a design error from an operating regime different from the one assumed.
| Mechanism | What activates it | Mark on the fracture surface | Mark in the microstructure | Reference or scope |
|---|---|---|---|---|
| Thermal fatigue | Start and stop gradients with expansion restrained | Network of short cracks perpendicular to the surface, oxide filled | Transgranular cracks from the hot face | Strain-controlled fatigue testing, ASTM E606; it does not reproduce the gradient, which is added with a custom cycling setup |
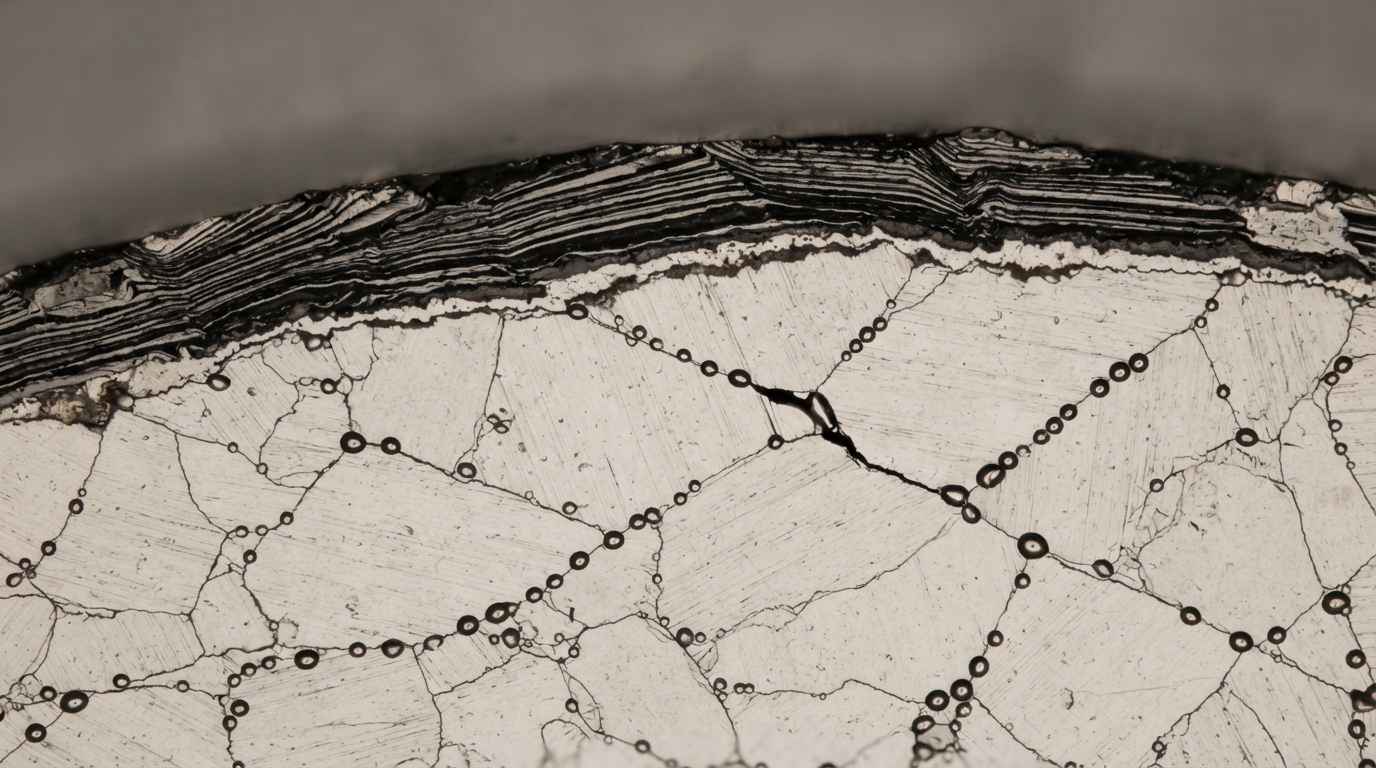
| Creep | Sustained stress above 40 per cent of the absolute melting temperature | Fishmouth opening with wall thinning and no striations | Cavities aligned on grain boundaries normal to the stress | Uniaxial creep testing in tension, ISO 204; gives strain rate and time to rupture, not the remaining life |
| High temperature oxidation and corrosion | Steam, combustion gases and ash or salt deposits | Thickness loss from the surface, with no single crack origin | Successive oxide layers and grain boundary attack under the scale | Thickness and layer sequence on a prepared section, with elemental analysis; scope, identify the agent and the exposure |
| Embrittlement | Prolonged time in the alloy’s own precipitation range | Flat faceted fracture, no deformation, on a cold start | Intermetallic phases or carbides at grain boundaries | Metallography on a section prepared to ASTM E3, with microhardness; scope, locate the precipitation and its distribution |
| Short-term overheating | Loss of flow or of cooling over minutes | Heavy plastic deformation with knife-edge lips | Microstructure transformed only in the hot zone | Comparison with an unaffected zone of the same part; scope, bracket the peak temperature from the phase changes |
TELL US ABOUT YOUR CASE
Do you have a unit down after a high temperature rupture? Send us the length unwashed and its position in the circuit and we will propose a test plan for the failure mechanism
Creep, oxidation and embrittlement, the mechanisms that work continuously
While thermal fatigue counts cycles, three mechanisms count hours: creep, high temperature oxidation and embrittlement through microstructural change. All three advance with the unit running steadily and none gives an external signal until late.
Creep and rupture under sustained stress
Creep is the progressive deformation of a material under constant load at elevated temperature, and it governs sizing above roughly 40 per cent of the alloy’s absolute melting temperature. In ferritic boiler steels that threshold falls between about 400 and 450 degrees Celsius.
The process has three stages and the last one is what matters. After an initial deformation that slows down comes a long stretch at almost constant rate, and at the end cavities appear on grain boundaries normal to the stress, which align, link up and open the crack. Finding isolated cavities in a metallographic replica is a different state from finding them already linked, and that figure turns an inspection into a replacement.
ISO 204 sets the method for uniaxial creep testing in tension, which gives the strain rate and the time to rupture under constant load and temperature. It is a test method, not an acceptance criterion: the minimum wall thickness and the acceptable remaining life are set by the equipment’s design code, and what the test contributes is the behaviour of the material as it is now.
A wall that has lost thickness to creep does not return to its earlier state and does not stop when the load drops. The figure that decides is the strain rate measured on the aged material, not the curve on the original material certificate.
High temperature oxidation and corrosion
High temperature oxidation consumes thickness from the surface and, when the scale it forms is not protective, consumption accelerates instead of slowing. In carbon and low alloy steels there is a known threshold: above about 570 degrees Celsius wustite appears, a loosely packed oxide that lets the scale grow much faster than the oxides formed below.
On the steam side there is also a feedback that makes the problem worse. The oxide scale conducts heat worse than the steel, so as it grows the metal temperature under it rises, and that temperature thickens the scale further while also accelerating creep.
On the gas side the agent is not only oxygen. Ash deposits, sulphates and molten alkali salts attack the protective scale, and the sulphur in the fuel forms fast growing sulphides. Identifying the agent means analysing the composition of the scale and the deposit, not just measuring how much thickness is gone, and the analysis of yellowing in stainless steels in high temperature applications shows how an oxide layer is characterised.
Embrittlement through microstructural change
Embrittlement is the loss of toughness caused by prolonged time at temperature, with no change in composition and no loss of thickness. The component keeps performing hot and breaks in a brittle way as it cools, which is why these failures show up during start-ups and hydraulic tests.
Each family has its range. In austenitic stainless steels sigma phase precipitates in the order of 600 to 900 degrees Celsius and leaves the material brittle at room temperature, so a part that has worked well for years cracks when handled during an outage. In chromium molybdenum boiler steels, prolonged time between about 350 and 550 degrees Celsius produces temper embrittlement, which raises the transition temperature and cuts the margin against a cold transient.
How each mechanism is told apart in the fracture and the microstructure
The five mechanisms leave distinct marks that are compatible with each other, so the diagnosis consists of ordering which acted first and which finished the job. The fracture gives the sequence and the microstructure gives the time and the temperature.
What the fracture surface says
The fracture surface separates the mechanisms by three features: how much deformation there is around it, whether the crack follows the grain boundaries, and how much oxide covers it. A tube ruptured by creep opens in a fishmouth with thick lips, little local deformation and an intergranular path, with a heavy internal oxide scale; one ruptured by short-term overheating shows heavy deformation, swelling and sharp knife-edge lips, because the material stretched before breaking.
That reading relies on imaging at several magnifications and on observing the section, which is the work of fractography and microscopy tests.
What the microstructure and the hardness say
The microstructure works as a record of temperature and time. On a section prepared to ASTM E3 you identify the creep cavities, the state of the carbides, the precipitated phases and the depth of attack under the scale, and each feature brackets a range of temperature and hours of exposure.
With that data, the failure mode study closes the loop back to operation: if the microstructure indicates a metal temperature 50 degrees Celsius above design, the problem is not the tube, it is the flow distribution, the internal deposit or the flame pattern.
A broken part from a pressure circuit is not only the cause of an outage, it is a sample with the thermal history of its zone written inside. Reading that thermal history says what is left in the sister parts still installed.
Temperature changes the mechanism, not just how fast the failure arrives
Power plant component failures are not explained by the strength criterion that works at room temperature, because at 500 or 900 degrees Celsius the material deforms under constant load, oxidises with a scale that in turn heats it further and loses toughness without losing composition.
If you have a rupture in a pressure circuit or in a thermal machine, send the length unwashed and unbrushed, with an adjacent length that has not failed, its position in the circuit and the nominal service temperature and pressure of that zone. You get the mechanism identified, the metal temperature estimated from the microstructure and the scope of what can be concluded about the sister parts. The operating history, the trend records and the internal incident report are handled afterwards and under a confidentiality agreement.
Frequently asked questions
What can be concluded about the sister parts still in service?
Their state can be bracketed, their failure date cannot be predicted. A broken part provides the mechanism, the metal temperature its microstructure reveals and the degree of damage accumulated in that zone, and all of that extrapolates to the parts sharing circuit, material and conditions. The step that turns it into a maintenance decision is sampling sister parts that have not failed, by metallographic replica if they cannot be removed, and comparing their carbide and cavity state with that of the broken one. Measuring the mechanical properties of the aged material gives the real margin to decide on, which is always smaller than the one on the original certificate.
Can you tell what temperature the metal reached if there is no record?
Yes, within a range, because the microstructure changes differently in each temperature band. The state of the carbides, the phases that have precipitated, the oxide layer sequence and its thickness bracket a band of temperature and exposure time, and comparing the damaged zone with a zone of the same part that ran cooler narrows that band. It does not give an exact value or a temperature history, it gives a range compatible with what is observed, and in practice that is enough to know whether the metal ran 50 degrees Celsius above the design value or at the temperature it was meant to.
How do you send a length of tube without destroying the evidence?
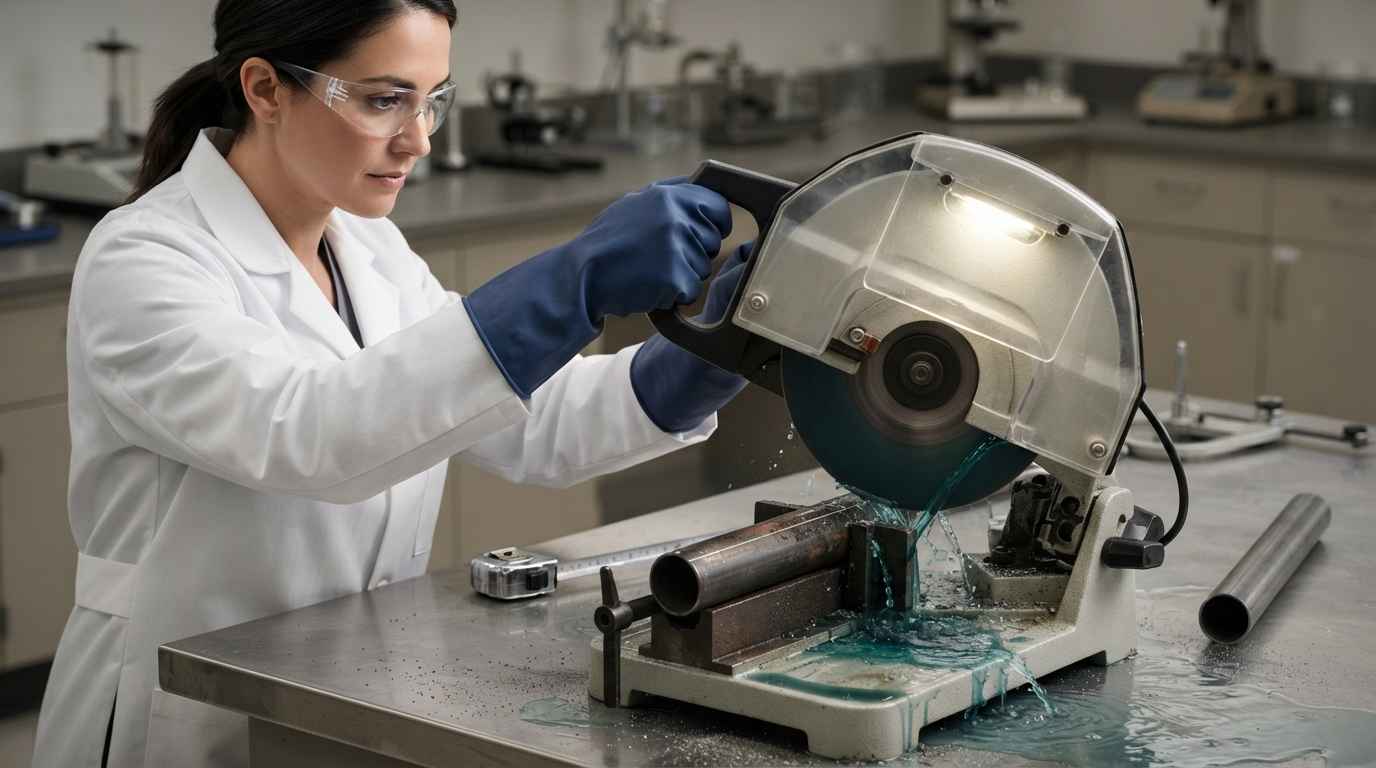
Unwashed, unbrushed and without cutting through the failed zone. The cut is made some 200 to 300 millimetres away from the crack, cold or with plenty of coolant, so no heat is introduced where the microstructure has to be measured. The internal deposits and the oxide scale are preserved, so the length is neither rinsed nor blown out, and the ends are capped so nothing comes loose in transport. If material has detached, send it in a separate identified container. And it pays to send an adjacent length that has not failed, of the same material, which gives the baseline.
What factors determine the cost of a failure analysis on a power plant component?
The cost is driven by the number of zones that have to be sectioned, whether a mechanical test at temperature is needed and the scope of the analysis of the oxide scale and the deposits. Identifying the mechanism on one part with fractography, metallography and hardness sits at the low end; adding a creep test on a specimen taken from the part, which needs time under load and temperature, or characterising several zones of a circuit, takes it to the high end. The way to adjust it is to narrow the question first, whether what you need is the cause of that rupture or the state of the rest of the installation, because the sampling scope changes a great deal between the two.
How long does the analysis of power plant component failures take with the plant down?
Usual turnaround runs from one to four weeks depending on scope, with an urgent route in 24 to 72 hours when a unit is out of service. Inspection, fractography and metallography with hardness are resolved at the low end of that range and are usually enough to decide whether the unit can be started; mechanical tests on extracted specimens and, above all, a creep test take up the high end because the test itself needs time. If you have a unit down, request an assessment with photographs of the zone and the nominal conditions, and you get the scope and the turnaround before the part is cut.