

Static failure and fatigue failure differ in one decisive way: static failure occurs when a single applied load exceeds the material’s strength, whereas fatigue failure develops progressively under loads that stay well below that strength but repeat thousands or millions of times. A shaft that never yields under its peak static load can still crack and separate after enough cycles, and that gap is exactly where most fatigue design mistakes hide. Getting it right belongs to the earliest stage of product development, not to a late verification step.
Sizing a part correctly means treating the static case and the cyclic case as two separate criteria, each with its own limit, its own safety factor and its own validation route. That reasoning sits at the heart of mechanical development, where geometry, material and load history are decided together, and where a clean 3D design and modeling using CAD gives you the notches, fillets and section changes that later govern how long a component survives.
MECHANICAL DEVELOPMENT
Are you designing a part that will bear cyclic loads? Discover our mechanical development service

What separates static failure from fatigue failure
Static failure depends on how large the load is; fatigue failure depends on how many times it repeats. That distinction is not academic: it decides which parameter governs the life of the part and therefore what has to be measured and controlled in the design.
Static failure: a single overload event
Static failure is a strength problem: the part fails the instant a load pushes the local stress past the yield strength (permanent deformation) or the ultimate tensile strength (fracture). It is a single-event mechanism, and you size against it by comparing the peak stress with a material limit measured in a monotonic tensile test. Ductile metals warn you with visible necking and plastic deformation before they break, which makes static overload relatively easy to diagnose after the fact, and gives an operator a margin of reaction that fatigue almost never grants. That difference matters in practice: a statically overloaded part usually deforms in a way someone notices and can act on, whereas a fatigue crack grows unseen inside a component that looks perfectly serviceable until the moment it separates. The two failures therefore call for different mindsets, one about the size of the worst load, the other about the number of ordinary loads.
Fatigue: damage accumulated below yield
Fatigue failure is a damage-accumulation problem. Each load cycle inflicts a tiny, invisible increment of microstructural damage, and once enough increments add up a crack forms and grows until the remaining section can no longer carry even a modest load. The stress amplitude that drives this can be a fraction of the yield strength, which is why a component that comfortably survives its worst static load still fails in service. The scale of the problem makes the point: a shaft turning at 1,500 revolutions per minute accumulates more than two million cycles in a single day of service, so a stress amplitude that looks harmless repeats often enough to initiate and grow a crack within weeks. That mismatch between intuition (a small load) and reality (a massive repetition) is what makes fatigue surprise even designs that clear the static calculation with room to spare. The distinction between how a part yields and how it cracks connects directly to the broader question of brittle versus ductile fracture, because the final separation in a fatigue failure is itself a fast fracture event.
A part sized only against its peak static load can still fail in service, because designing for cyclic loads answers a different question: not whether the material breaks under one load, but how many times it can survive a smaller one.
How a fatigue crack starts and grows
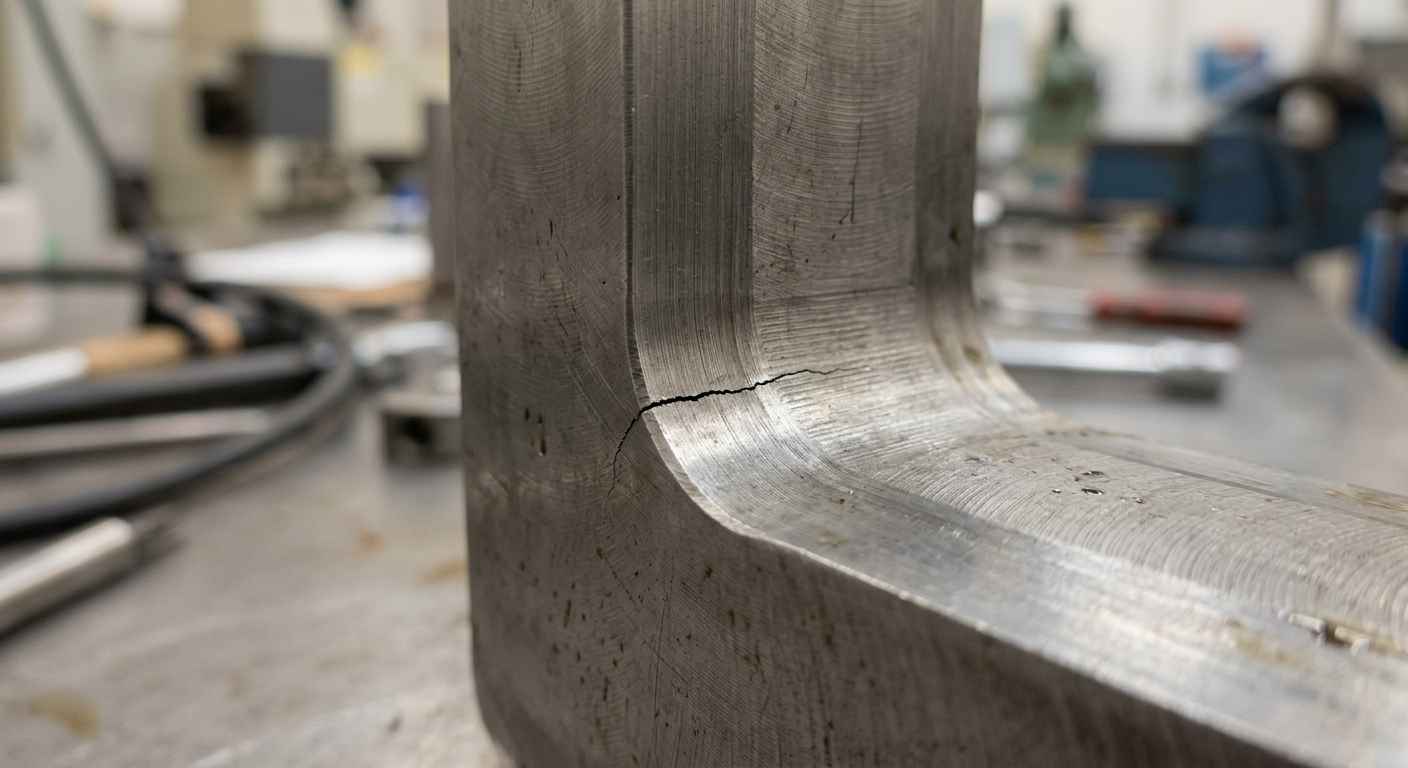
A fatigue crack develops in three stages: initiation at a stress concentrator, stable propagation cycle by cycle, and a final fast fracture when the intact cross-section is overwhelmed. Understanding the sequence tells you where to look during design and where a component is most vulnerable in service.
Where cracks initiate
Initiation almost always happens at a point of locally raised stress: a sharp fillet, a keyway, a thread root, a weld toe, a machining mark, a corrosion pit or a subsurface inclusion. These stress concentrators multiply the nominal stress by a factor that depends on geometry, so a global stress that looks safe can be locally two or three times higher. Surface finish matters here more than almost anywhere else, because most cracks start at the surface and a rough finish is a field of micro-notches. The effect of a concentrator is not proportional but multiplicative: a small fillet radius can triple the local stress relative to the nominal value, so a part that on paper works at 30 percent of its limit is, at the root of that notch, actually close to it. That is why two components identical in dimensions but different in finish or radii can have fatigue lives that differ by an order of magnitude. Characterising the material’s real mechanical properties, including how a given alloy and heat treatment respond to cyclic loading, is what lets you predict where initiation will occur rather than discover it after a return.
How the crack propagates to fracture
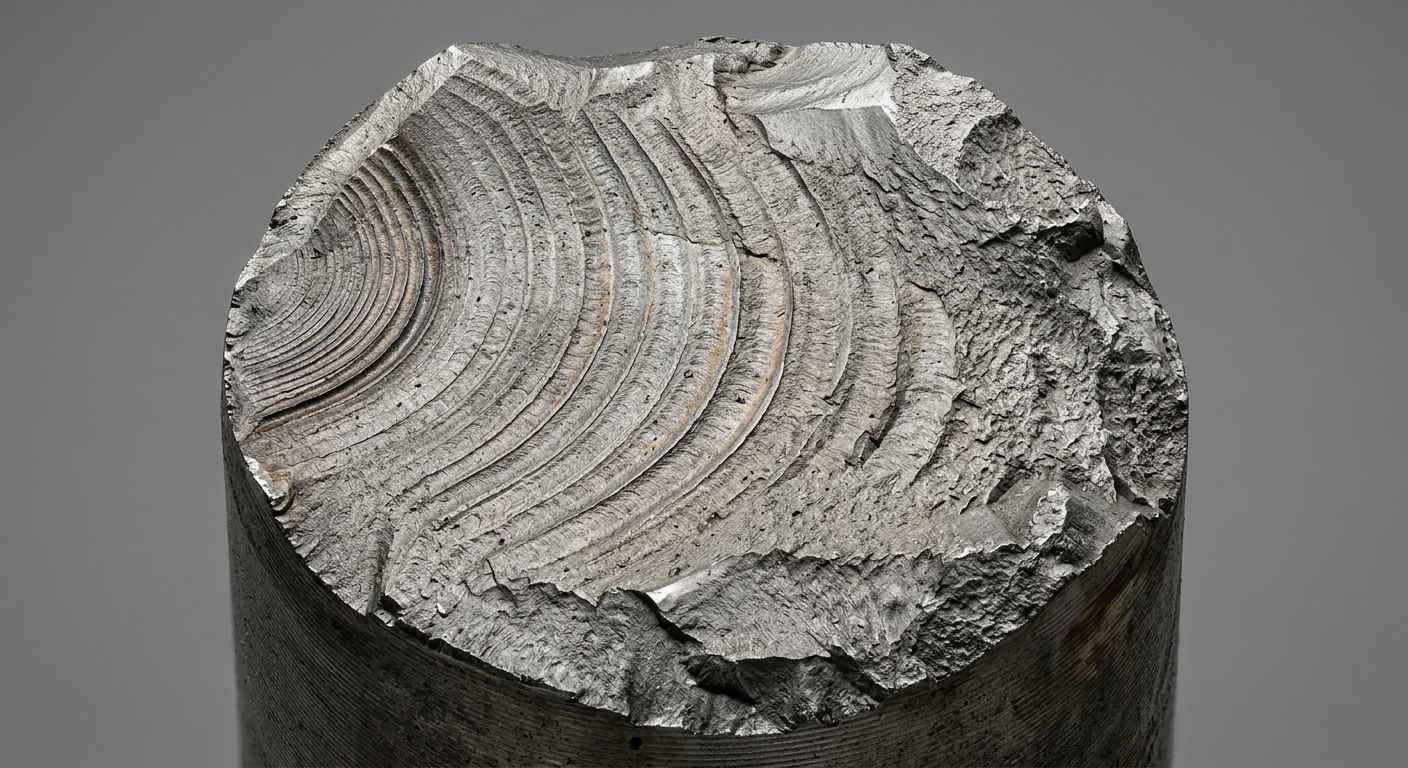
Once initiated, the crack advances a small distance on each cycle, often leaving the characteristic beach marks that make a fatigue fracture recognisable under fractographic examination. Propagation is stable and progressive, which means the failure is developing long before anything is visible externally. When the crack has grown enough that the remaining ligament can no longer carry the peak load, the part separates suddenly in a final overload fracture, which is itself a static event in miniature and can be ductile or brittle depending on the material and the conditions. That is why fatigue failures so often feel sudden to the operator even though the damage took most of the component’s life to accumulate, and why the visible instant of failure is only the end of a process that started much earlier at a stress concentrator. Reconstructing this history is the core of any failure analysis, where the crack origin, propagation direction and final fracture zone are read directly off the broken surface.
Fatigue cracks initiate at stress concentrators, propagate stably cycle by cycle, and only separate the part in a final fast fracture, which is why the failure feels abrupt even though the damage accumulated over most of the component’s service life.
TELL US ABOUT YOUR CASE
Do you have a component to size against fatigue? Send us your case and we will propose a fatigue calculation and its validation
How to size for cyclic loads
Sizing for fatigue means matching a stress amplitude to a number of cycles the part must survive, and then applying a margin. The central tool is the S-N curve (also called the Wohler curve), which plots stress amplitude against cycles to failure for a given material and condition. From it you read the endurance behaviour that governs the design, and everything else in fatigue design is a correction to that baseline.
The S-N curve and the fatigue limit
The fatigue limit (or endurance limit) is the stress amplitude below which certain materials, notably many steels, can in principle sustain an effectively unlimited number of cycles without failing. Many non-ferrous alloys, including aluminium, show no true limit, so instead you define a fatigue strength at a target life such as one or ten million cycles. You build the S-N baseline from controlled laboratory tests: force-controlled axial fatigue follows ISO 1099, while strain-controlled axial fatigue, which captures the low-cycle regime where plastic strain dominates, follows ISO 12106. The curve you obtain describes a specimen, so it has to be corrected for the real part before it means anything, and that correction is where most of the engineering judgement lives. The S-N curve is not a universal property of the material either: it shifts with surface finish, heat treatment and the type of loading, so a datasheet curve measured on a polished specimen rarely represents the real part. Serious sizing therefore starts from a curve measured on the actual material and surface condition rather than from a generic reference that usually errs on the unsafe side.
Mean stress, notches and load spectra
Real components rarely see fully reversed loading around zero. A superimposed mean stress shifts the allowable amplitude, and you account for it with a Goodman or Haigh construction that trades mean stress against amplitude up to the tensile strength. On top of that you apply factors for surface finish, size, stress concentration and loading type, each of which pulls the specimen curve down toward the component’s real capacity. Finally, service loading is a spectrum of amplitudes rather than one constant cycle, so you accumulate damage across the spectrum with the Palmgren-Miner rule, summing the fraction of life consumed at each amplitude until it reaches unity. None of these corrections is optional: skip the notch factor and you overestimate life at the very point where the crack will start; skip the spectrum and you calibrate the design on a load history the part never sees. That spectrum is no minor detail: a handful of high-amplitude peaks, however rare, consume a disproportionate fraction of life compared with thousands of mild cycles, so a spectrum that omits them can overstate life by several factors. Where telemetry of the real application exists, measuring the load histogram often adds more accuracy than refining the material model itself. The table below sets the two criteria side by side.
| Criterion | Static failure | Fatigue failure |
|---|---|---|
| Load type | Single peak load | Cyclic load repeated over time |
| Governing stress | Can reach or exceed yield / ultimate strength | Often well below yield strength |
| Failure mode | Yielding or single overload fracture | Crack initiation, stable growth, final fracture |
| Design limit | Yield or ultimate tensile strength | Fatigue limit or fatigue strength at target life |
| How to size | Peak stress against strength, with safety factor | S-N curve corrected for mean stress, notch, finish; Palmgren-Miner over the spectrum |
| Warning before failure | Visible deformation in ductile metals | Little or no external warning |
Mistakes when sizing for fatigue and how to validate it
The most expensive fatigue errors are conceptual, not arithmetic. They come from applying static reasoning to a cyclic problem, and they survive design reviews precisely because the static numbers look comfortable.
The recurring sizing errors
The first mistake is sizing only against the static peak load and assuming a healthy static safety factor covers everything, when the amplitude that drives fatigue may be a small fraction of that peak. The second is ignoring stress concentrators, treating a nominal section stress as if the fillet or thread root next to it saw the same value. The third is ignoring surface finish and treating a machined or as-cast surface as if it were polished, which can cut fatigue strength dramatically. The fourth is validating against idealised, smooth loads instead of the noisy, variable-amplitude signal the part actually experiences, which hides the damaging peaks entirely. Each of these turns a part that passes on paper into one that cracks in the field.
Validating the design by test
Fatigue predictions carry real uncertainty, so a sized component should be confirmed by physical testing before it is committed to production. Coupon tests on the actual material establish or verify the S-N basis, and component-level tests under a representative load spectrum confirm that the geometry, surface and joints behave as the calculation assumed. When a part has already failed, the same tools work in reverse: fractographic examination locates the crack origin and reads the propagation history, and mechanical characterisation confirms whether the material met specification. That combined route is what lets a fatigue analysis and redesign of cracked components turn a recurring failure into a corrected design, and what a hinge failure analysis uses to separate a material defect from an under-sized geometry. Verifying the alloy itself through testing of metallic materials and alloys closes the loop between the number on the drawing and the metal in your hand.
A fatigue calculation is a hypothesis about service life, and physical testing on the real material and load spectrum is what turns that hypothesis into a design you can trust in production.

From the S-N curve to a design that lasts in service
Durable components come from treating the static and cyclic cases as two independent criteria and sizing for the harder one. You check the peak load against yield and ultimate strength, then check the load spectrum against a fatigue limit or a target-life fatigue strength corrected for mean stress, notches and surface finish, and you accumulate the damage across the real spectrum rather than a convenient constant amplitude. The part that survives is the one whose weakest stress concentrator, roughest surface and heaviest load cycle were all accounted for before the drawing was released, not the one with the largest static margin. Sizing well for fatigue is rarely about choosing a stronger material: it is about controlling the stress amplitude, smoothing the concentrators, protecting the surface finish and validating the result against the real load spectrum the part will see.
If you are chasing a component that cracks in service, or you want to confirm a fatigue calculation before committing tooling, send us the broken parts or a representative sample together with the measured or estimated load history, and you will get the crack origin identified, the material verified against specification and a redesign direction backed by test data.
Frequently asked questions about fatigue design
What is the difference between static failure and fatigue failure?
Static failure happens when a single load pushes the local stress past the material’s yield or ultimate strength, while fatigue failure builds up gradually under cyclic loads that stay below that strength. The static case is a one-off strength check; the fatigue case is a damage-accumulation problem measured in cycles, which is why a part that survives its peak load can still crack after enough repetitions.
What is the fatigue limit?
The fatigue limit is the stress amplitude below which a material can sustain an effectively unlimited number of load cycles without failing. Many steels show a genuine fatigue limit, while aluminium and other non-ferrous alloys do not, so for those you define a fatigue strength at a target life such as one or ten million cycles instead of a true limit.
How do you size a part for fatigue?
You size a part for fatigue by building an S-N curve for the material, reading the allowable stress amplitude at the required number of cycles, and correcting it for mean stress, stress concentrators, size and surface finish. For variable service loads you then sum the damage from every amplitude in the spectrum with the Palmgren-Miner rule and apply a safety factor before releasing the design.
Why does a part fail below its yield strength?
A part fails below its yield strength because fatigue is driven by repeated small loads, not by a single large one. Each cycle adds microscopic damage at a stress concentrator until a crack forms and grows, so a component that never yields can still separate after enough cycles. Surface finish, notches and inclusions accelerate this, which is why real service life depends on far more than the static strength number.
Which standards govern fatigue testing?
Axial force-controlled fatigue of metals is covered by ISO 1099, and axial strain-controlled fatigue, which addresses the low-cycle regime, by ISO 12106. These define how specimens are loaded and how cycles to failure are recorded so that S-N data is comparable and usable for design. If you need an S-N basis for a specific alloy and heat treatment, send us a representative sample and we will run the characterisation.