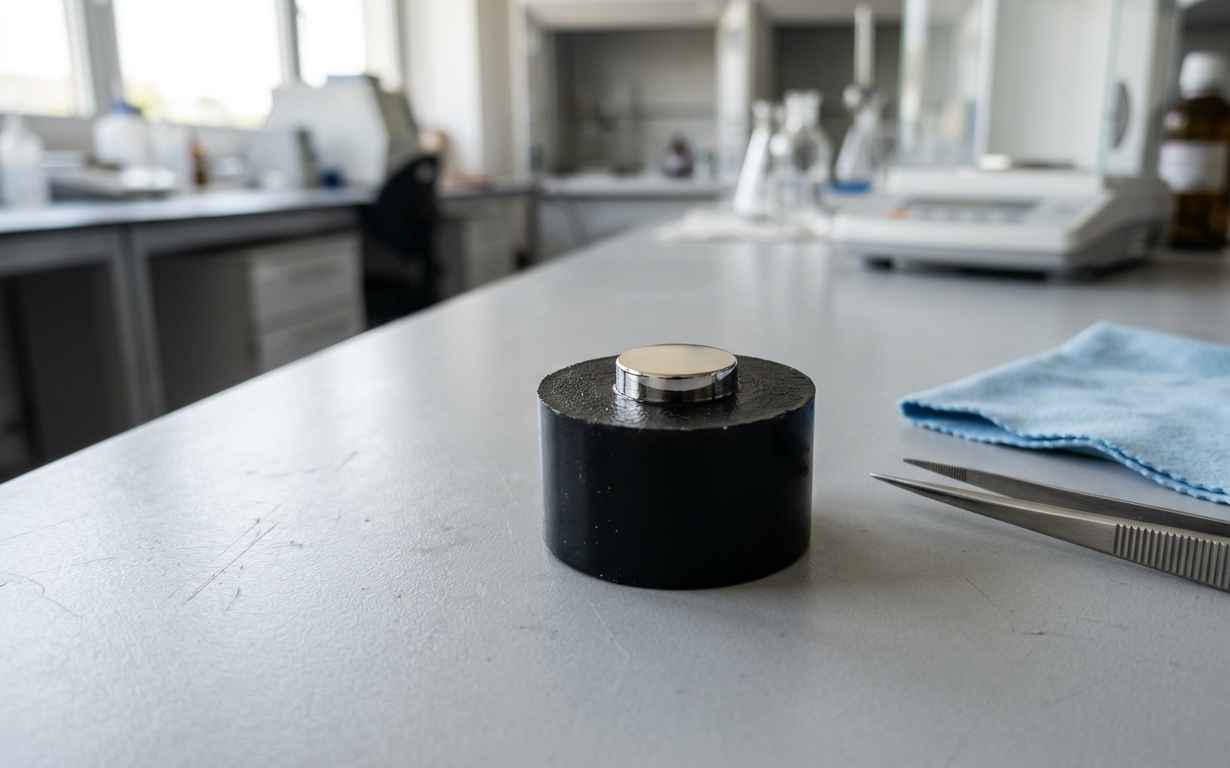

A metallographic test reveals the internal structure of a metal under the microscope and answers three questions: how the material is built inside, what inclusions and defects it contains, and whether the heat treatments were carried out correctly. Working from a properly prepared specimen (sectioning, mounting, grinding, polishing and chemical etching) examined under the microscope, it becomes possible to explain phenomena that no single mechanical test can account for on its own, from a premature fracture to a loss of toughness or a fatigue failure.
Before going into detail, it helps to place the test within the wider set of available analyses. As an industrial materials testing laboratory, INFINITIA combines metallography with chemical composition, hardness and mechanical testing, so that every result is cross-checked against the others. Within that toolkit, the metallographic testing service is the one that delivers the structural reading the others cannot provide. This external team with independent metallurgical judgement approach avoids isolated conclusions and builds a coherent diagnosis instead, one in which every microscopic finding is placed in context with the manufacturing history of the part and with the conditions of its real service.
METALLOGRAPHIC TESTING
Do you need to know the microstructure of a metal? Discover our metallographic testing service

Microstructure, the first level of reading in a metallographic test
Microstructure is the arrangement of phases, grains and constituents that make up a metal at the microscopic scale, and it is the first piece of information a metallographic test reveals. That arrangement is far from an academic detail; it directly governs the strength, ductility, hardness and toughness of the component. Two steels with identical chemistry can behave in opposite ways when their microstructure differs, because the distribution of phases and the grain size control how the material deforms and how it breaks. This is why the microstructural reading is the starting point of any serious diagnosis of a metal part.
Phases, grains and constituents seen under the optical microscope
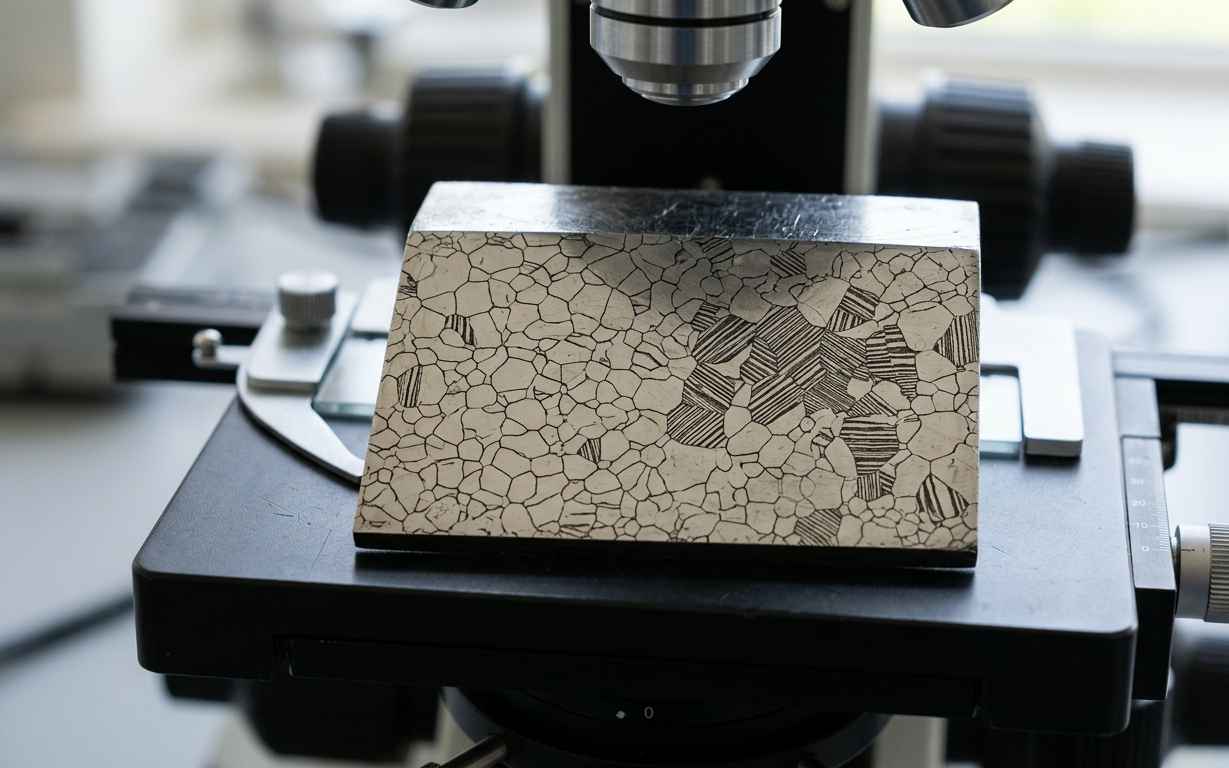
Optical microscopy is the core technique of metallography, and it identifies the phases and constituents present once a suitable chemical etch has been applied. In a carbon steel, for instance, constituents such as ferrite (soft and ductile), pearlite (alternating lamellae of ferrite and cementite), cementite (hard and brittle) and, in treated materials, martensite and bainite become distinguishable. The most common etchant, nital (nitric acid in ethanol), reveals grain boundaries and contrasts the phases by attacking them at different rates, so they appear with distinct tones and relief under the microscope light.
Specimen preparation entirely conditions what can be seen. The ASTM E3 standard defines good practice for metallographic preparation (sectioning without overheating, mounting, progressive grinding and mirror polishing), because any deformation introduced while preparing the sample can be mistaken for a genuine feature of the material. A poorly polished surface produces scratches, pull-outs or surface deformation that mask the true microstructure. Interpretation therefore means separating what belongs to the material from what the handling introduced, a judgement that only the experience of an industrial technical consultant used to reading these images can provide.
Microstructure is the fingerprint of the manufacturing process: each constituent records what happened to the metal during solidification, forming and heat treatment.
Optical examination also reports on homogeneity. A well-processed material shows a uniform distribution of phases, whereas segregation banding, decarburised zones or hardness gradients appear as visible differences between adjacent regions of the same section. That contrast, properly documented, guides the next stages of the analysis, such as the verification of the alloy composition or the microhardness measurement over the constituents of interest.
Grain size and its link to mechanical properties
Grain size is the average dimension of the crystals that make up the metal, and it is one of the parameters metallography reveals most clearly because of its direct effect on properties. The Hall-Petch relationship describes the general principle: a fine grain raises the yield strength and improves toughness, since the many grain boundaries hinder the movement of dislocations, whereas a coarse grain tends to mean lower strength and greater brittleness. Quantifying that size is therefore an indirect yet reliable measure of the mechanical performance to expect.
Quantification is carried out with standardised methods. The ASTM E112 standard (and its equivalent ISO 643) defines the grain size index through comparison, planimetric or linear intercept procedures that assign an ASTM number to the sample. A high index corresponds to fine grain and a low index to coarse grain. This figure matters especially in components subject to fatigue or high service temperatures, where uncontrolled grain growth during processing can drastically shorten the service life of the part.
Grain size also carries a clear process meaning. A fine, uniform grain usually reflects controlled forming and a well-managed heat treatment, whereas coarse or mixed grain often signals excessive soak temperature, prolonged holding times or an interrupted recrystallisation. Reading that history from the structure lets the analysis move beyond a pass or fail verdict and point towards the specific processing step that needs correction, which is precisely the kind of insight a manufacturer can act on to stabilise production.
The grain reading makes full sense only when cross-referenced with the rest of the analysis. An abnormally large grain alongside an out-of-specification hardness value usually points to a poorly executed heat treatment or to overheating during forming. Interpreting that combination of clues, rather than stopping at the isolated figure, is what separates a useful metallographic report from a mere description of images, and it is the mindset behind the testing of metallic materials and alloys.
Inclusions and discontinuities: the cleanliness of the material under the lens
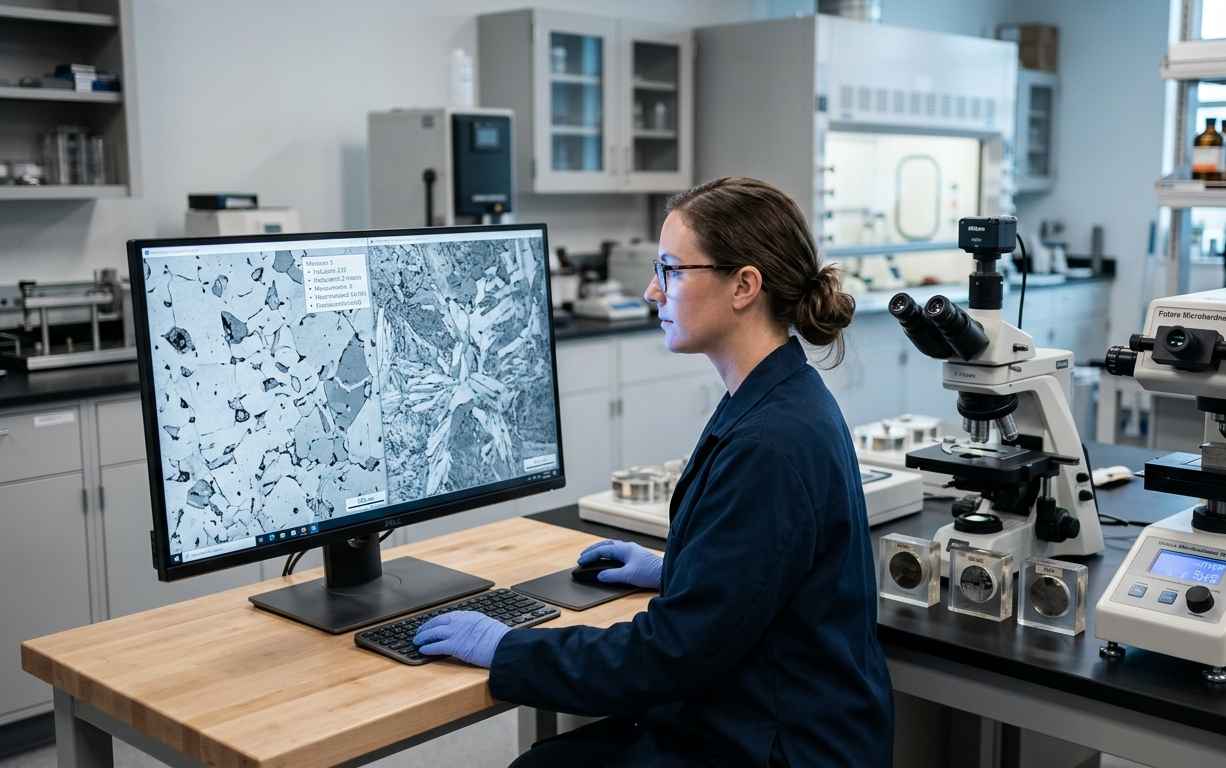
Inclusions are non-metallic particles trapped in the metal during its production, and their type, size and distribution are the second major finding a metallographic test reveals. Inclusion cleanliness directly conditions fatigue strength, ductility and the material’s ability to be machined or welded without defects. A steel can meet its nominal composition and still fail in service if its inclusion level exceeds what the application allows, because each particle acts as a stress concentrator and a potential crack initiation site.
Types of non-metallic inclusions and their standardised rating
Inclusion rating is the standardised classification of non-metallic particles by nature, shape and abundance, which metallography performs on a polished, unetched specimen. The usual families include sulphides (type A), aluminates (type B), silicates (type C) and globular oxides (type D), each with a different origin and a different effect on material behaviour. Sulphides, for example, elongate during rolling and can create anisotropy, whereas hard oxides promote the onset of fatigue cracks.
The ASTM E45 and ISO 4967 standards set out the methods to determine inclusion content and assign severity indices by comparison with reference charts. That numerical result makes it possible to accept or reject heats, compare suppliers and correlate steel cleanliness with failures observed in service. In sectors such as automotive or energy, where components work under fatigue for millions of cycles, inclusion control is a quality requirement as strict as the chemistry itself.
A material can have the right chemistry and the right hardness, and still fail by fatigue if its inclusion level is not under control. Metallography is the technique that makes that cleanliness visible.
Inclusion distribution matters as much as the count. A low overall level can still be problematic if the particles cluster in a critical region or align along the working direction, since a local concentration governs where a fatigue crack will start. Metallography maps that spatial pattern across the section, distinguishing a clean matrix with occasional isolated particles from one carrying stringers or bands. That distinction often explains why two batches with similar average ratings perform very differently under cyclic loading.
The precise characterisation of a specific inclusion often demands going beyond optics. When its exact chemical nature matters, scanning electron microscopy with microanalysis (SEM-EDX) identifies the elements that make up the particle, distinguishing, for instance, an aluminium oxide from a manganese sulphide. That combination of optics for counting and SEM-EDX for identification is what allows the metallurgical origin of the defect to be explained, rather than merely noting its presence.
Pores, cracks and segregation that compromise service
Discontinuities are internal defects such as pores, cracks, shrinkage cavities or segregation that break the continuity of the metal, and which metallography locates and characterises over the examined section. Unlike inclusions, which are foreign particles, these defects are voids or heterogeneities of the material itself, generated during solidification, forming or welding. Their presence reduces the effective load-bearing section and, above all, introduces stress concentrators that accelerate the onset and propagation of cracks.
Metallography distinguishes the origin of each discontinuity by its morphology and location. Shrinkage porosity shows dendritic edges characteristic of solidification, a quench crack follows intergranular paths, and a lack of fusion in a weld appears along the joint line with recognisable geometry. This ability to read the defect and assign it a cause is essential in the analysis and improvement of welds, where examining the macro and microstructure of the bead reveals the true quality of the joint.
The value of this examination becomes clear in failure analysis. In a root-cause investigation of failures in factory equipment, the metallographic section of the broken part makes it possible to reconstruct the failure sequence: where the crack began, how it progressed, and which defect or anomalous microstructure encouraged it. That diagnosis turns an unexplained fracture into a specific, actionable cause the client can address to prevent recurrence.
When those defects end in failure, the next step is distinguishing a ductile from a brittle fracture on the failure surface itself.
TELL US ABOUT YOUR CASE
Do you have a metal part to analyse by metallography? Send us your case and we will propose a complete metallographic test
Heat treatments: how metallography verifies their execution
A heat treatment is the set of controlled heating and cooling cycles that modify the microstructure of a metal to tune its properties, and metallography is the technique that verifies whether that treatment was carried out correctly. Observing the resulting structure reveals unambiguously whether a quench reached the intended hardness, whether a temper was completed, or whether an anneal homogenised the material. Where hardness gives a figure, metallography explains why that figure is what it is, providing the microstructural evidence that justifies it.
Microstructural evidence of quenching, tempering and annealing
Each heat treatment leaves a recognisable microstructural signature that metallography identifies on an etched specimen. A correct quench in a steel produces martensite, a fine, hard acicular structure formed by rapid cooling from austenite. A subsequent temper transforms that martensite into tempered martensite, tougher, with fine carbide precipitation. An anneal, by contrast, generates equilibrium structures (ferrite and coarse pearlite) that favour machinability and ductility over hardness.
Reading these signatures makes it possible to detect process deviations. Free ferrite in a part that should be fully martensitic indicates an incomplete quench, whether from insufficient temperature or from cooling that was too slow. A bainitic structure where martensite was expected points to an inadequate cooling rate. These findings, which no mechanical test reveals on its own, are the foundation of the analysis of heat treatments for metals, where metallography and hardness combine to certify the quality of the process.
A heat treatment is planned with a temperature curve, but it is proven with a microstructure. Metallography is the objective witness that the cycle was met exactly as intended.
The metallurgical detail that optics cannot resolve is addressed with SEM. The morphology and distribution of fine carbides after tempering, or the identification of minor phases, are observed with the resolution of scanning electron microscopy, which magnifies well beyond the optical limit. That additional scale is useful when the component specification is demanding and the difference between a correct and a defective treatment comes down to fine details of the microstructure.
Case depth, decarburisation and correlation with hardness
Case depth is the thickness of the surface-hardened zone in treatments such as carburising, nitriding or induction hardening, and metallography measures it directly on the transverse section. Many components (gears, shafts, cams) require a hard, wear-resistant surface over a tough core that absorbs impacts. Metallography reveals that structural gradient from the case to the core and allows its thickness to be measured precisely, confirming that it matches what was specified.
Measuring the case demands careful preparation of the section, because poor polishing at the edge can round the sample and distort the observed thickness. For that reason the gradient is examined on a properly mounted transverse specimen, where the transition from the treated surface to the core is seen continuously and free of artefacts. That rigour in preparation, combined with a standardised measurement, is what gives the result its validity against a purchase specification or a client requirement.
Decarburisation is another critical finding that metallography detects with ease. It consists of the loss of carbon at the surface during heating in an oxidising atmosphere, and it appears as a band of surface ferrite softer than the underlying material. That decarburised layer lowers fatigue strength and surface hardness, and it can ruin the performance of a part that otherwise meets its composition and its treatment. Documenting its thickness is a routine check in forged and treated components.
The real diagnostic power emerges when microstructure is correlated with hardness. Microhardness profiles measured to ISO 6507 (Vickers) or ISO 6508 (Rockwell) are overlaid on the metallographic images, so that each hardness value is tied to a specific structure. This correlation, complemented by hardness testing of materials, turns a set of figures into a physical explanation of the part’s behaviour, closing the loop between what is seen and what is measured.
The table below summarises what metallography reveals according to the type of finding, with the main technique and the reference standard associated with each case.
| Type of finding | What it reveals | Main technique | Reference standard |
|---|---|---|---|
| Phases and constituents | Structural make-up and its effect on strength and ductility | Optical microscopy with nital etch | ASTM E3 |
| Grain size | Expected level of strength and toughness | Optical microscopy (intercept or planimetry) | ASTM E112 / ISO 643 |
| Non-metallic inclusions | Material cleanliness and fatigue failure risk | Optics on polished specimen and SEM-EDX | ASTM E45 / ISO 4967 |
| Pores, cracks and segregation | Defect origin and its impact on service | Macro and optical microscopy | ASTM E3 |
| Heat treatment | Correct execution of quenching, tempering or annealing | Optics and SEM, with hardness profile | ASTM E3 / ASTM E407 (+ ISO 6507 for the hardness profile) |
| Case depth and decarburisation | Hardened zone thickness and surface carbon loss | Transverse section with microhardness | ISO 6507 |
Metallography as technical evidence for decision-making
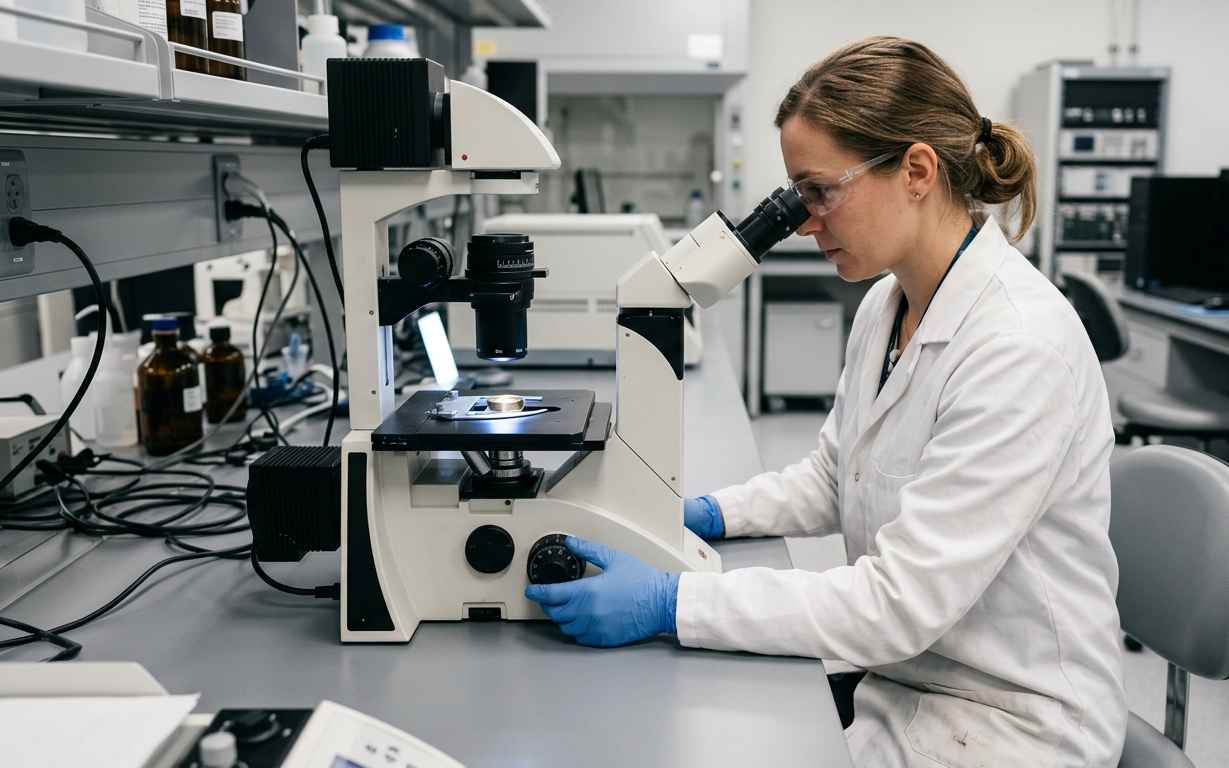
A metallographic test reveals, in a single well-executed preparation, three decisive layers of information: the microstructure that governs properties, the inclusion cleanliness and discontinuities that condition reliability, and the objective evidence of whether heat treatments were carried out correctly. Its value lies not in the isolated image but in the cross-interpretation with composition, hardness and mechanical testing, which turns an observation into an actionable diagnosis. One development of this analysis, supported by dedicated instrumentation, is reflected in the design and manufacture of a customised setup for tailored testing of metal parts, where metallography is combined with rigs adapted to each component.
If you have a part that doesn’t behave as it should and neither hardness nor composition explains it, metallography usually gives the answer. Send us the sample and we’ll tell you what it reveals.
Frequently asked questions about the metallographic test
What exactly is a metallographic test?
A metallographic test is the analysis of the internal structure of a metal by preparing a specimen and examining it under the microscope. It reveals the phases, grain size, inclusions, discontinuities and evidence of heat treatment. From that information the mechanical behaviour of the material is explained and failures or process deviations are diagnosed that no single test can account for on its own.
What is the difference between optical microscopy and SEM in metallography?
Optical microscopy characterises phases, grain and inclusions up to moderate magnification limits, whereas SEM (scanning electron microscopy) reaches far higher magnification and resolution. Optics is the base technique for most findings, and SEM is reserved for fine detail and, with EDX microanalysis, for identifying the chemical composition of a specific inclusion or phase. The two are complementary, chosen according to how demanding the case is.
How does metallography detect a defective heat treatment?
Metallography detects a defective treatment by comparing the observed microstructure with the one the specified cycle should produce. Free ferrite in a part that should be martensitic, unexpected bainite, or an insufficient hardened case are direct evidence of a deviation. These findings, cross-referenced with hardness profiles to ISO 6507 or ISO 6508, confirm whether the quench, temper or carburising met its objective.
Which standards govern the metallographic test?
The metallographic test draws on recognised standards according to the parameter being evaluated. ASTM E3 covers specimen preparation, ASTM E112 and ISO 643 cover grain size, and ASTM E45 and ISO 4967 cover inclusion rating. For the associated hardness, ISO 6507 (Vickers) and ISO 6508 (Rockwell) apply. Using the right standard ensures the results are comparable, traceable and defensible before a client or an audit.
In which sectors is a metallographic test most useful?
A metallographic test is especially useful in automotive, energy and the metallurgical sector, where component reliability is critical. In automotive it verifies gears and treated parts under fatigue, in energy it controls welds and high-temperature materials, and in the metallurgical sector it validates heats and forming processes. In all of them it provides the microstructural evidence needed to accept product, investigate failures and improve processes. The same reading also supports supplier qualification and incoming inspection, since it exposes differences between batches that data sheets alone never capture, and it gives engineering teams an objective basis on which to release, reject or rework a component with confidence.