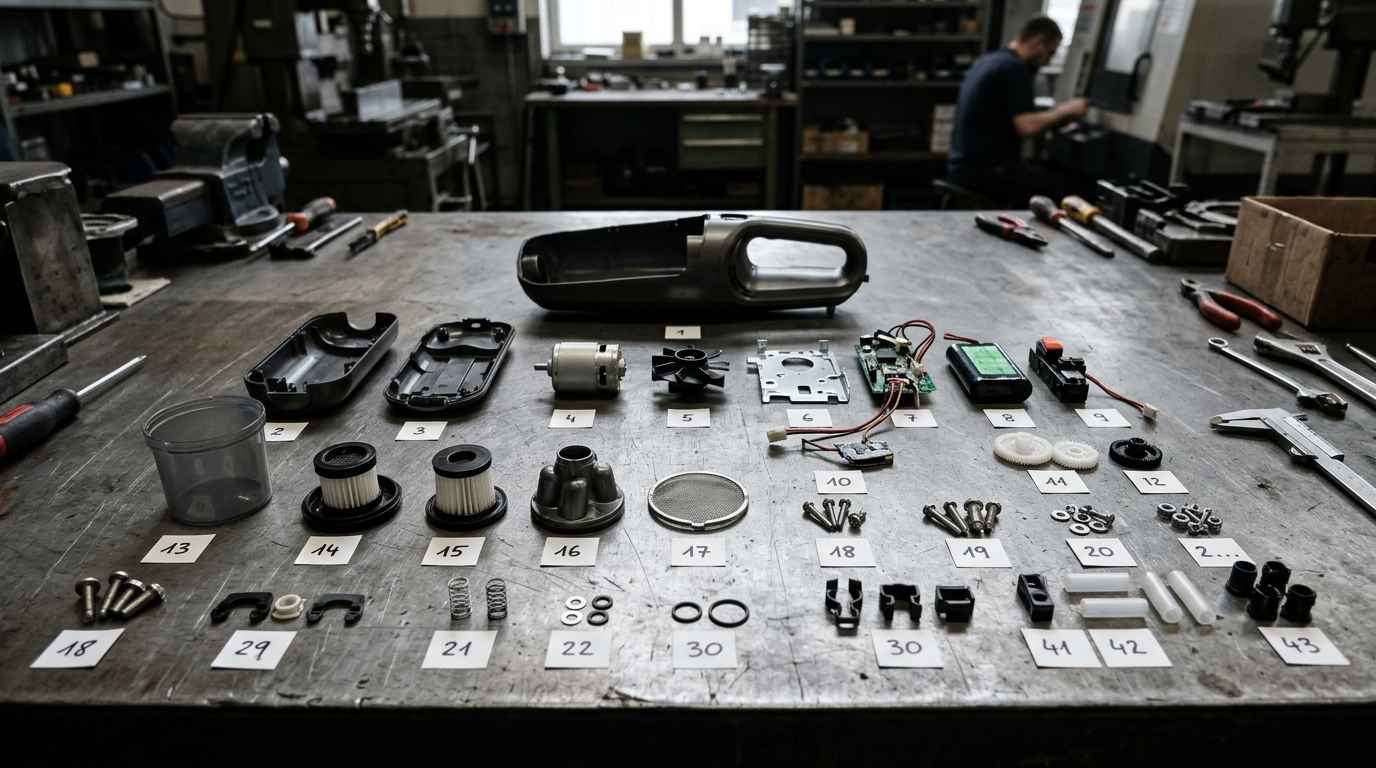

Electronics failure analysis determines which element of an electronic assembly stopped working, by what mechanism and at what point in its life, separating a manufacturing defect from wear caused by cycling and from a one-off overvoltage event.
That separation is what decides what to do. A process defect affects an identifiable batch and is corrected on the line, whereas thermal cycling fatigue is a design problem that will reappear in every unit once it reaches its number of cycles, something that testing of electronic components on sound units can anticipate. Failure analysis deals precisely with telling them apart before the scope of a campaign is decided.
In forensic engineering the electronic assembly has an awkward peculiarity, the evidence is fragile and most of the techniques that provide answers are destructive. The order of work is not a procedural detail, it is the difference between reaching a conclusion and losing the evidence halfway.
FAILURE ANALYSIS
Are you getting returns of boards that fail with no clear cause? Take a look at our failure analysis

What fails in an electronic assembly and why
Three different things fail in an electronic assembly, the solder joint that connects the component to the board, the board laminate itself with its vias and tracks, and the component inside. Each one fails through different mechanisms and leaves different marks, so identifying which of the three has given way is the first step and sets the order for everything that follows.
What is almost never the failure, even though it is the first thing suspected, is a component that was defective from the start. Statistically the weak link of an assembly is the interconnection, because that is where the mechanical and thermal stresses of the assembly are concentrated. The component is a rigid block and the board a laminate that moves, and the solder is what sits in between.
Electronics failure analysis, the three possible origins
Every electronic failure fits one of three origins according to when it appears. A manufacturing defect is present from the first power-up and shows itself early, in the first hours or in the first demanding cycle. Wear appears late, after cycles or hours of service have built up, and affects different units at similar times. A one-off event, an overvoltage or a discharge, bears no relation to the age of the part.
That classification by time of appearance is more useful than any list of defects, because it frames the question before anything is opened. If returns are concentrated in an age interval, you are looking at wear. If they are spread evenly between new and old units, you are looking at field events or a latent defect in a batch, and what you need there is the manufacturing date of each returned unit.
Gathering that data before the laboratory saves half the work. The time distribution of returns is an input to the diagnosis of the root cause of the failure that cannot be reconstructed afterwards, and it is usually available in the warranty system at no cost.
When an electronic failure appears says as much as the physical mark it leaves. A manufacturing defect shows itself early and in one batch, and fatigue appears late and in every unit.
Solder fatigue from thermal cycling
Solder joint fatigue occurs because the component and the board expand differently. Every switch-on and switch-off imposes a small relative displacement that the solder absorbs by deforming, and that repeated deformation accumulates damage until a crack opens. No overload is needed, the difference in expansion coefficients and enough cycles are sufficient.
The risk depends on geometry more than on material. A large, rigid ceramic component without flexible leads concentrates the displacement in the corner joints, which are the ones furthest from the neutral point. That is why the first failures always appear in the balls or leads on the perimeter, and finding them there confirms the mechanism.
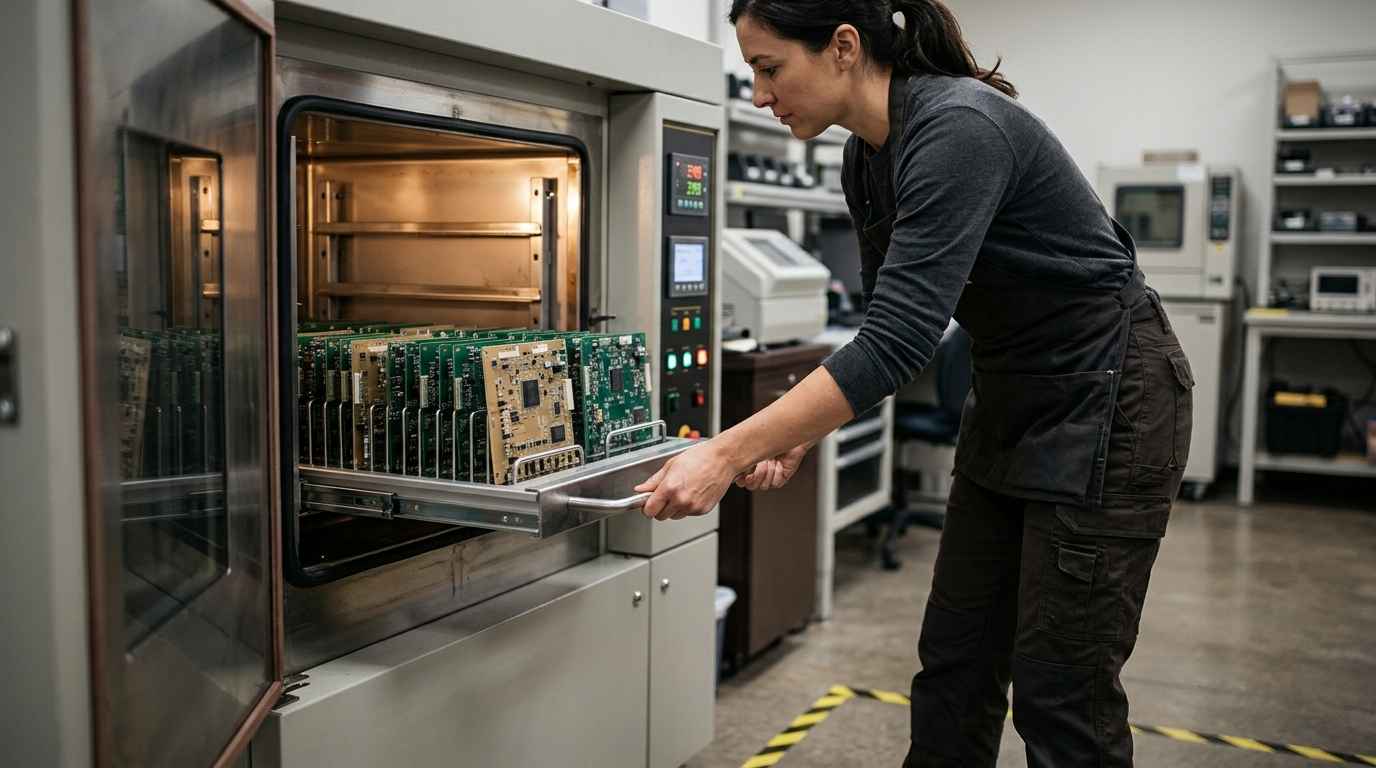
The reference for characterising this in the laboratory is IPC-9701, which sets out the test methods and qualification requirements for surface mount solder attachments on rigid, flexible and rigid-flex structures, with thermal cycling, thermal shock and power cycling tests, and a section of its own on failure analysis. Applying cycling in a thermal shock chamber to sound units reproduces the mechanism and shows at how many cycles it appears.
Board and solder joint failures
Solder joint failures that are not fatigue come from the process, and board failures come from the laminate and its interaction with moisture. They are told apart because the former are present from the start even if they take time to show, and the latter need time, moisture and applied voltage to develop.
Process defects in PCB soldering
Process defects are recognised by the shape of the meniscus and by what is inside the joint. A solder joint with insufficient wetting shows a high contact angle and a poor interface, whereas an apparently correct joint can hide internal voids that reduce the effective cross-section. In hidden contact components, the joint does not fully form and the connection works electrically until a thermal cycle opens it.
Those defects are assessed against the IPC acceptance criteria for electronic assemblies, which is the framework that sets which joint shape is accepted and at what level of stringency according to the product class. Using that criterion rather than a visual impression is what allows you to state that a joint is out of specification and not simply that it looks bad.
There is one defect that depends on storage and not on the line. A plastic component that has absorbed moisture can delaminate internally when it goes through the reflow oven, because the water evaporates suddenly. IPC/JEDEC J-STD-020 classifies the moisture sensitivity of non-hermetic surface mount devices so that they are packed, stored and handled in a way that prevents damage during reflow or rework. The standard itself warns that passing this test is not enough on its own to guarantee long term reliability.
Laminate degradation, moisture and migration
The laminate fails in two ways. The mechanical way appears as delamination between layers or as copper lifting around a pad, common when the board has been flexed during assembly or handling. The electrical way appears as loss of insulation between closely spaced conductors when moisture and a sustained potential difference coincide.
That loss of insulation has a specific mechanism, electrochemical migration. With condensed moisture and applied voltage, the metal dissolves at the positive conductor and is deposited towards the negative one, forming branches that end up bridging them. The trace is unmistakable under the microscope, a dendritic growth between tracks, and it is usually accompanied by flux residues that supply the necessary ions.
There is a variant that occurs inside the laminate and not on the surface, which is why it escapes visual inspection. It is the formation of a conductive filament that progresses along the interface between the glass fibre and the resin, between two vias or between a via and a nearby track. It needs the same three conditions, absorbed moisture, a sustained potential difference and a fibre path connecting the two conductors, and it shows up as a leak that comes and goes with ambient humidity before becoming permanent.
The failure analysis of flexible circuits and electronic components shows why the substrate matters as much as the circuit, since a flex circuit adds repeated bending stress to everything above. In market returns, reverse engineering of defective electronic boards in claims is the route when there is no documentation of the assembly and what the board carried has to be reconstructed.
| Failure mode | When it appears | Characteristic mark | Confirming technique |
|---|---|---|---|
| Joint fatigue from cycling | After thermal cycles build up | Progressive crack in the meniscus or next to the intermetallic | Metallographic cross-section and cycling to IPC-9701 |
| Insufficient wetting or cold joint | From the first power-up | High contact angle and poor interface | Optical inspection and X-ray of the joint |
| Internal voids in the joint | From manufacture | Voids that reduce the effective cross-section | Two dimensional X-ray or tomography |
| Package delamination during reflow | In the assembly process | Internal separation and crack in the package | J-STD-020 moisture classification and cross-section |
| Electrochemical migration | With moisture and sustained voltage | Dendritic growth between conductors | Electron microscopy with microanalysis and ionic analysis |
| Overvoltage or electrostatic discharge | One-off event, unrelated to age | Localised melting or crater on a track or on the die | Component decapsulation and microscopy |
TELL US ABOUT YOUR CASE
Do you have a batch of returns and need to know whether it is a process defect or design fatigue? Send us five or six failed units with their manufacturing date and we will tell you what mechanism lies behind it
How an electronic failure is analysed without destroying the evidence
The analysis of an electronic assembly moves from non-destructive to destructive, and never the other way round. First it is documented and measured without touching it, then the suspect area is located with techniques that do not alter the sample, and only at the end is it cut, decapsulated or separated, because those steps cannot be undone.
Optical inspection and X-ray of the solder joint
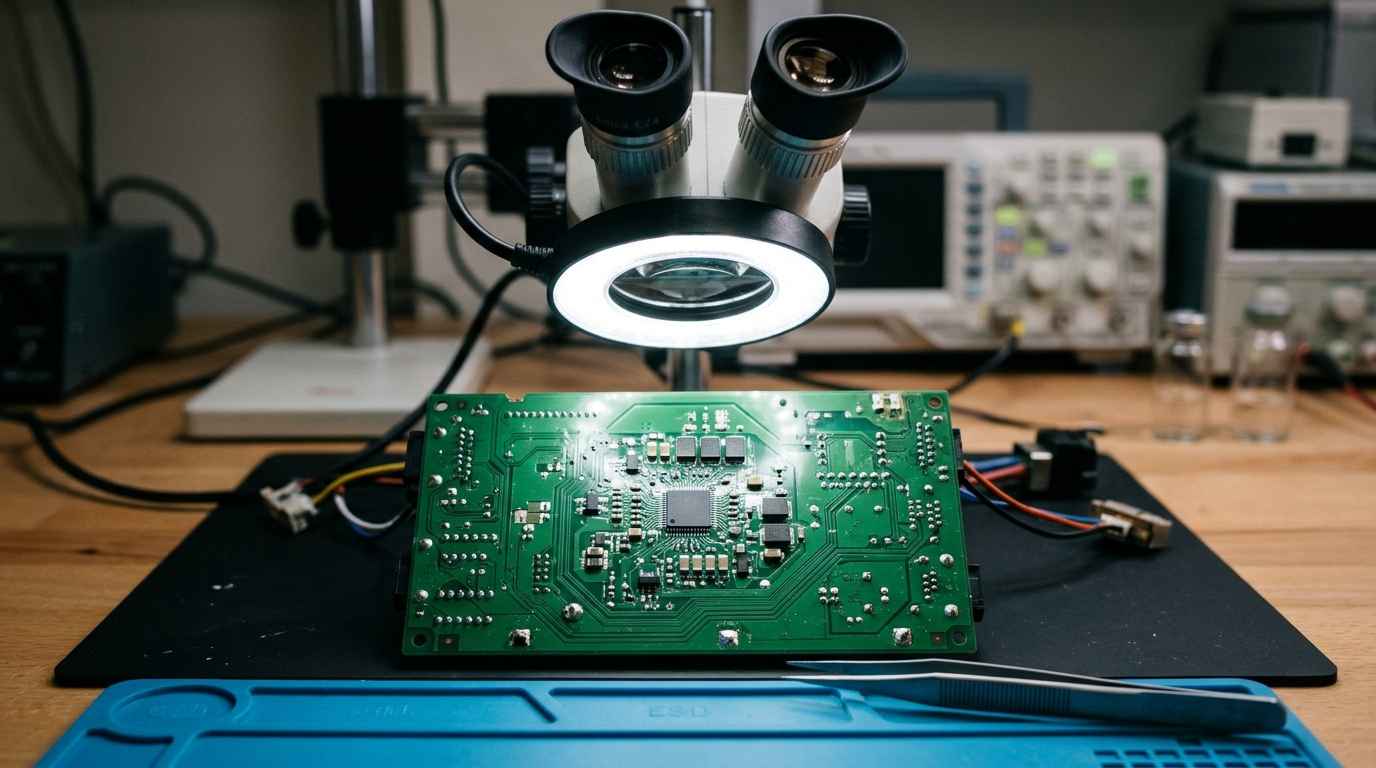
Optical inspection with a magnifier and a stereo microscope solves more cases than one might think, especially residues, corrosion, dendrites and defective menisci that are visible. Before that, the complete board is photographed on both sides and any previous repair marks are noted, as they completely change the interpretation of what comes next.
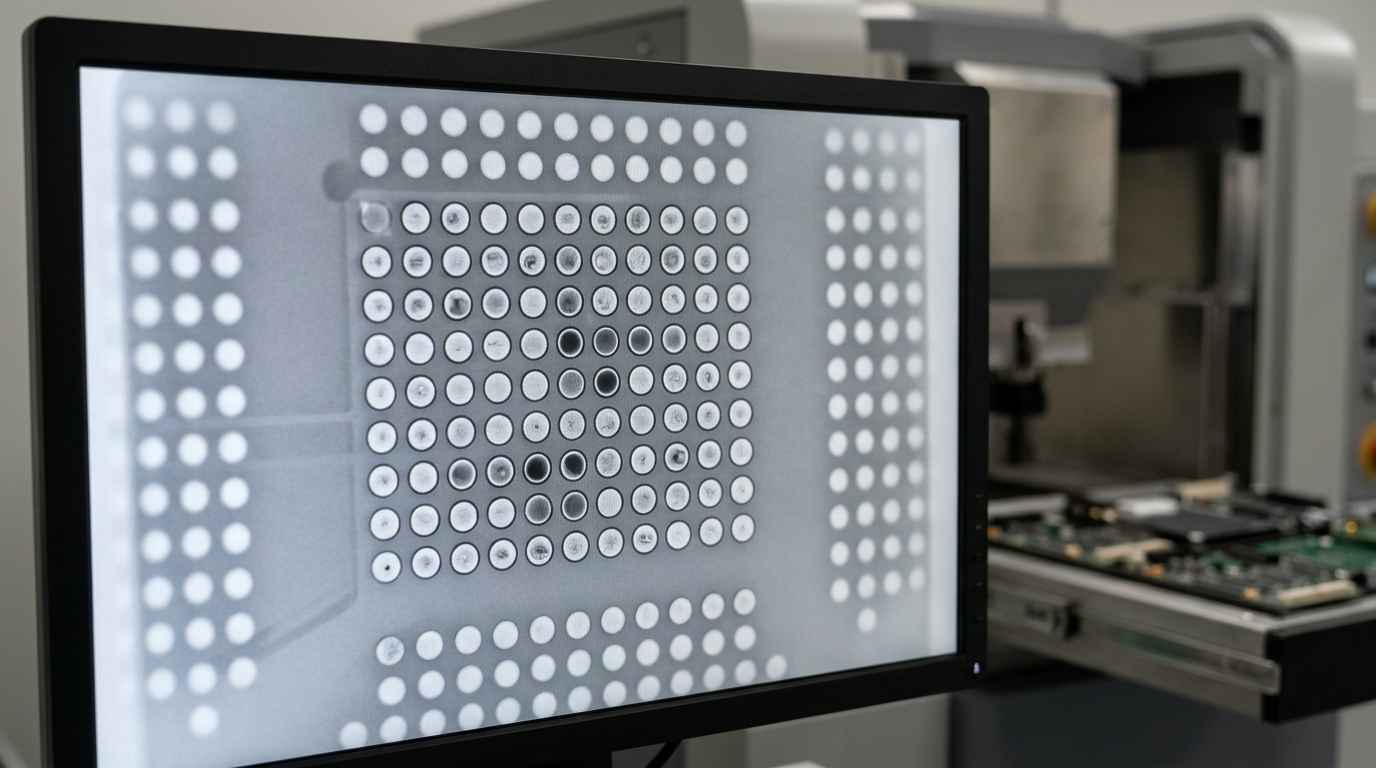
X-ray is the key tool in surface mount assembly, because it allows you to see inside joints hidden under the component. In two dimensions it detects voids, shorts between balls and missing balls, and in tomography it reconstructs the joint in volume and locates internal cracks without cutting anything. For a hidden contact device it is the only way to see the condition of the joint with the board intact.
Electrical characterisation of the electronic assembly
Electrical characterisation completes this phase. Measuring the resistance of the interconnection chain, tracing a track and comparing the curves of a component against a good unit places the failure in a specific area of the board. The materials involved and their limits are covered in the materials for electronics that make up the assembly.
Metallographic cross-section and microanalysis of the solder joint
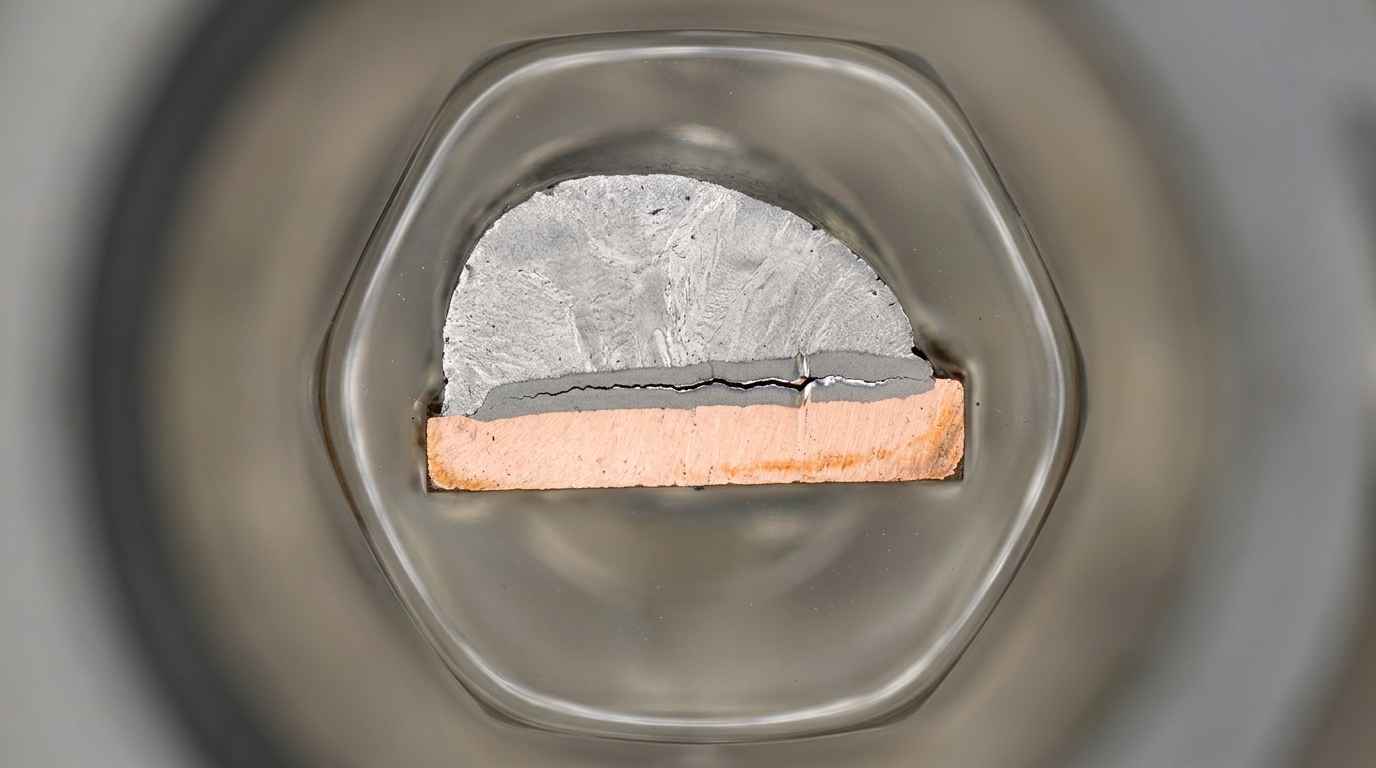
The metallographic cross-section is the step that turns a suspicion into a conclusion. The area of interest is embedded in resin, cut along the plane that contains the joint and polished until the complete section is visible. That is where the morphology of the crack appears, its path and the layer of intermetallic compound that forms between the solder and the copper of the pad.
For hidden contact components there is an intermediate method that is cheap and very informative. The assembly is impregnated with a penetrating dye that enters any open crack, it is dried and the component is then pulled off the board. The joints that appear dyed were already cracked before the separation, and those that break clean were sound. That gives in one go the map of which joints had failed and in which positions of the array, which is what confirms whether the pattern corresponds to perimeter fatigue.
Crack morphology and failure mode
Crack morphology distinguishes the mechanism and is the basis of any failure mode study. A fatigue crack runs through the joint progressively and usually follows the contour of the meniscus or advances alongside the intermetallic layer, whereas a fracture from a one-off overload shows a clean tear with no advancing front. The thickness of the intermetallic also reveals the thermal history, because it grows with temperature and time.
When the damage is inside the component and not in the joint, the route is to open the package to reach the chip. Decapsulation shows whether there is a melted area, a discharge crater or a corroded metallisation, and that is where the decision is made between an intrinsic component failure and damage induced from the board. It is also the step that detects a component that is not what it claims to be, a scenario that is no longer rare in purchases through unauthorised channels and that has its own verification route in the detection of counterfeit components.
The correct sequence is document, measure, X-ray and only then cut. Reversing that order destroys the only sample that could confirm the failure mode.
From an isolated failure to a decision on the batch
A properly closed electronic failure analysis answers three questions with the same sample, which element gave way, by what mechanism and whether that mechanism affects only the returned units or the whole production. The last one is the one with economic consequences, because it separates a one-off replacement from a campaign on the installed base.
What most often prevents getting there is not the technique, it is the sample. A single failed unit does not allow chance to be told apart from a pattern, and a unit that someone has tried to repair carries a second thermal cycle that erases the original condition of the joints. With five or six untouched units and two working reference units, the analysis compares and concludes.
Gather those units, their manufacturing date, a description of how the failure showed itself and the service conditions with their temperature range and daily cycles. With that material the non-destructive sequence is followed, the cut is made where it belongs and you receive the failure mode identified, the mechanism and an estimate of the scope across the batch.
Frequently asked questions about electronics failure analysis
Can a board that has already been repaired be analysed?
It can, but with limited interpretation. A repair subjects the area to a second thermal cycle and changes the meniscus, the intermetallic thickness and the flux residues, which are exactly the three things read to date the failure. The analysis is still useful to identify the affected component and rule out mechanisms, and it is advisable to provide alongside it some failed unit that nobody has touched. That is why the first instruction on receiving a return is not to try to repair or clean it.
How many failed units are needed?
Five or six failed units are needed, plus two reference units that work correctly. With a single unit it is possible to identify what gave way, but not to state that the mechanism is systematic or to estimate the scope across the batch. The reference units are just as important, because many of the quantities measured, such as the intermetallic thickness or the resistance of a chain, only make sense when compared with the normal condition of the same product.
What factors determine the cost of an electronics failure analysis?
The cost depends on the number of units, how deep the analysis has to go and whether the failure needs to be reproduced. Optical inspection with X-ray on a few boards is the most contained scenario and solves quite a few cases. It rises with tomography, with metallographic cross-sections that require embedding and polishing each sample, with contamination microanalysis and with component decapsulation. Reproducing the mechanism through cycling adds the test time to the budget.
What risk do you take if you replace the units without analysing the failure?
You risk repeating the failure with the replacement units and not knowing until the next wave of returns. If the mechanism is cycling fatigue, every new unit will fail once it reaches its number of cycles, so replacing only shifts the problem in time and multiplies the logistics cost. You also lose the chance to narrow down the affected batch, because the returned units are discarded and with them the traceability that allowed the campaign to be defined.
How long does an electronics failure analysis take?
Typical lead times range from one to four weeks depending on the depth of the analysis. The non-destructive phase, with inspection, X-ray and electrical characterisation, is closed at the lower end of that range. Metallographic cross-sections, microanalysis and decapsulation add sample preparation, and reproducing the mechanism through cycling depends on the number of cycles required. For a stopped line or a blocked shipment there is an urgent 24 to 72 hour option covering the scope that can be closed in that time.